Tuesday, January 06, 2009
DataProtector 6.00 vs 6.10
No matter what you do for a copy, DataProtector will have to read all of one Disk Media (50GB by default) to do the copy. So if you multiplex 6 backups into one Disk Writer device, it'll have to look through the entire media for the slices it needs. If you're doing a session copy, it'll copy the whole session. But object copies have to be demuxed.
DP6.00 did not handle this well. Consistently, each Data Reader device consumed 100% of one CPU for a speed of about 300 MB/Minute. This blows serious chunks, and is completely unworkable for any data-migration policy framework that takes the initial backup to disk, then spools the backup to tape during daytime hours.
DP6.10 does this a lot better. CPU usage is a lot lower, it no longer pegs one CPU at 100%. Also, network speeds vary between 10-40% of GigE speeds (750 to 3000 MB/Minute), which is vastly more reasonable. DP6.10, unlike DP6.00, can actually be used for data migration policies.
Labels: backup, benchmarking, hp, storage, sysadmin
Thursday, October 02, 2008
MSA performance in the new config
Yes, a profligate waste of space but at least it'll be fast. It also had the added advantage of not needing to stripe in like Raid5 or Raid6 would have. This alone saved us close to two weeks flow time to get it back into service.
Another benefit to not using a parity RAID is that the MSA is no longer controller-CPU bound for I/O speeds. Right now I have a pair of writes, each effectively going to a separate controller, and the combined I/O is on the order of 100Mbs while controller CPU loads are under 80%. Also, more importantly, Average Command Latency is still in the 20-30ms range.
The limiting factor here appears to be how fast the controllers can commit I/O to the physical drives, rather than how fast the controllers can do parity-calcs. CPU not being saturated suggests this, but a "show perf physical" on the CLI shows the queue depth on individual drives:
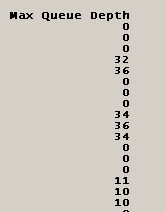
The drives with a zero are associated with LUNs being served by the other controller, and thus not listed here. But a high queue depth is a good sign of I/O saturation on the actual drives themselves. This is encouraging to me, since it means we're finally, finally, after two years, getting the performance we need out of this device. We had to go to an active/active config with a non-parity RAID to do it, but we got it.
Labels: benchmarking, msa, storage, sysadmin
Wednesday, September 03, 2008
EVA4400 + FATA
Key points I've learned:One thing I alluded to in the above is that Random Read performance is rather bad. And yes, it is. Unfortunately, I don't yet know if this is a feature of testing methodology or what, but it is worrysome enough that I'm figuring it into planning. The fastest random-read speed turned in for a 10GB file, 64KB nibbles, came to around 11 MB/s. This was on a 32-disk disk-group on a Raid5 vdisk. Random Read is the test that closest approximates file-server or database loads, so it is important.The "Same LUN" test showed that Write speeds are about half that of the single threaded test, which gives about equal total throughput to disk. The Read speeds are roughly comperable, giving a small net increase in total throughput from disk. Again, not sure why. The Random Read tests continue to perform very poorly, though total throughput in parallel is better than the single threaded test.
- The I/O controllers in the 4400 are able to efficiently handle more data than a single host can throw at it.
- The FATA drives introduce enough I/O bottlenecks that multiple disk-groups yield greater gains than a single big disk-group.
- Restripe operations do not cause anywhere near the problems they did on the MSA1500.
- The 4400 should not block-on-write the way the MSA did, so the NetWare cluster can have clustered volumes on it.
The "Different LUN, same disk-group," test showed similar results to the "Same LUN" test in that Write speeds were about half of single threaded yielding a total Write throughput that closely matches single-threaded. Read speeds saw a difference, with significant increases in Read throughput (about 25%). The Random Read test also saw significant increases in throughput, about 37%, but still is uncomfortably small at a net throughput of 11 MB/s.
The "Different LUN, different disk-group," test did show some I/O contention. For Write speeds, the two writers showed speeds that were 67% and 75% of the single-threaded speeds, yet showed a total throughput to disk of 174 MB/s. Compare that with the fasted single-threaded Write speed of 130 MB/s. Read performance was similar, with the two readers showing speeds that were 90% and 115% of the single-threaded performance. This gave an aggregate throughput of 133 MB/s, which is significantly faster than the 113 MB/s turned in by the fastest Reader test.
Adding disks to a disk-group appears to not significantly impact Write speeds, but significantly impact Read speeds. The Read speed dropped from 28 MB/s to 15 MB/s. Again, a backup-to-disk operation wouldn't notice this sort of activity. The Random Read test showed a similar reduction in performance. As Write speeds were not affected by restripe, the sort of cluster hard-locks we saw with the MSA1500 on the NetWare cluster will not occur with the EVA4400.
And finally, a word about controller CPU usage. In all of my testing I've yet to saturate a controller, even during restripe operations. It was the restripe ops that killed the MSA, and the EVA doesn't seem to block nearly as hard. Yes, read performance is dinged, but not nearly to the levels that the MSA does. This is because the EVA keeps its cache enabled during restripe-ops, unlike the MSA.
HP has done an excellent job tuning the caches for the EVA4400, which makes Write performance exceed Read performance in most cases. Unfortunately, you can't do the same reordering optimization tricks for Read access that you can for Writes, so Random Read is something of a worst-case scenario for these sorts of disks. HP's own documentation says that FATA drives should not be used for 'online' access such as file-servers or transactional databases. And it turns out they really meant that!
That said, these drives sequential write performance is excellent, making them very good candidates for Backup-to-Disk loads so long as fragmentation is constrained. The EVA4400 is what we really wanted two years ago, instead of the MSA1500.
Still no word on whether we're upgrading the EVA3000 to a EVA6100 this weekend, or next weekend. We should know by end-of-business today.
Labels: benchmarking, hp, msa, storage, sysadmin
Tuesday, September 02, 2008
EVA4400 testing
Sequential Write speed: 79,065 KB/s
Sequential Read speed: 52,107 KB/s
That's a VERY good number. The Write speed above is about the same speed as I got on the MSA1500 when running against a Raid0 volume, and this is a Raid5 volume on the 4400. The 10GB file-size test I did before this one I also watched the EVA performance on the monitoring server, and controller CPU during that time was 15-20% max. Also, it really used both controllers (thanks to MPIO).
Random Write speed: 46,427 KB/s
Random Read speed: 3,721 KB/s
Now we see why HP strongly recommends against using FATA drives for random I/O. For a file server that's 80% read I/O, it would be a very poor choice. This particular random-read test is worst-case, since a 100GB file can't be cached in RAM so this represents pure array performance. File-level caching on the server itself would greatly improve performance. The same test with a 512MB file turns in a random read number of 1,633,538 KB/s which represents serving the whole test in cache-RAM on the testing station itself.
This does suggest a few other tests:
- As above, but two 100MB files at the same time on the same LUN
- As above, but two 100MB files at the same time on different LUNs in the same Disk Group
- As above, but two 100MB files at the same time on different LUNs in different Disk Groups
Labels: benchmarking, hp, msa, storage
Friday, August 29, 2008
Storage update
And today we schlepped the whole EVA4400 to the Bond Hall datacenter.
And now I'm pounding the crap out of it to make sure it won't melt under the load we intend to put on it. These are FATA disks, which we've never used so we need to figure it out. We're not as concerned with the 6100 since that's FC disks, and they've been serving us just fine for years.
Also on the testing list, making sure MPIO works the way we expect it to.
Labels: benchmarking, storage
Wednesday, May 14, 2008
NetWare and Xen
Guidelines for using NSS in a virtual environment
Towards the bottom of this document, you get this:
Nice stuff there! The "xenblk barriers" can also have an impact on the performance of your virtualized NetWare server. If your I/O stream runs the server out of cache, performance can really suffer if barriers are non-zero. If it fits in cache, the server can reorder the I/O stream to the disks to the point that you don't notice the performance hit.Configuring Write Barrier Behavior for NetWare in a Guest Environment
Write barriers are needed for controlling I/O behavior when writing to SATA and ATA/IDE devices and disk images via the Xen I/O drivers from a guest NetWare server. This is not an issue when NetWare is handling the I/O directly on a physical server.
The XenBlk Barriers parameter for the SET command controls the behavior of XenBlk Disk I/O when NetWare is running in a virtual environment. The setting appears in the Disk category when you issue the SET command in the NetWare server console.
Valid settings for the XenBlk Barriers parameter are integer values from 0 (turn off write barriers) to 255, with a default value of 16. A non-zero value specifies the depth of the driver queue, and also controls how often a write barrier is inserted into the I/O stream. A value of 0 turns off XenBlk Barriers.
A value of 0 (no barriers) is the best setting to use when the virtual disks assigned to the guest server’s virtual machine are based on physical SCSI, Fibre Channel, or iSCSI disks (or partitions on those physical disk types) on the host server. In this configuration, disk I/O is handled so that data is not exposed to corruption in the event of power failure or host crash, so the XenBlk Barriers are not needed. If the write barriers are set to zero, disk I/O performance is noticeably improved.
Other disk types such as SATA and ATA/IDE can leave disk I/O exposed to corruption in the event of power failure or a host crash, and should use a non-zero setting for the XenBlk Barriers parameter. Non-zero settings should also be used for XenBlk Barriers when writing to Xen LVM-backed disk images and Xen file-backed disk images, regardless of the physical disk type used to store the disk images.
So, keep in mind where your disk files are! If you're using one huge XFS partition and hosting all the disks for your VM-NW systems on that, then you'll need barriers. If you're presenting a SAN LUN directly to the VM, then you'll need to "SET XENBLK BARRIERS = 0", as they're set to 16 by default. This'll give you better performance.
Labels: benchmarking, netware, novell, NSS, OES, storage, virtualization
Monday, April 02, 2007
Concurrency, again
Some typical results, units are in KB/s
| Initial write | 11058.47 | |
| Rewrite | 11457.83 | |
| Read | 5896.23 | |
| Re-read | 5844.52 | |
| Reverse Read | 6395.33 | |
| Stride read | 5988.33 | |
| Random read | 6761.84 | |
| Mixed workload | 8713.86 | |
| Random write | 7279.35 |
Consistantly, write performance is better than read performance. On the tests that are greatly benefitted by caching, reverse read and stride read, performance was quite acceptable. All nine machines wrote at near flank speed for 100MB ethernet, which means that the 1GB link the server was plugged in to was doing quite a bit of work during the Initial Write stage.
What is perhaps the most encouraging is that CPU loading on the server itself stayed below the saturation level. Having spoken with some of the engineers who write this stuff, this is not surprising. They've spent a lot of effort in making sure that incoming requests can be fulfilled from cache and not go to disk. Going to disk is more expensive in Linux than in NetWare due to architectural reasons. Had the working set been 4GB or larger I strongly suspect that CPU loading would have been significantly higher. Unfortunately, as school is back in session I can't 'borrow' that lab right now as the tests themselves consume 100% of the resources on the workstations. Students would notice that.
The next step for me is to see if I can figure out how large the 'working set' of open files on FacShare is. If it's much bigger than, say, 3.2GB we're going to need new hardware to make OES work for us. This won't be easy. A majority of the size of the open files are outlook archives (.PST files) for Facilities Management. PST files are low performance critters, so I don't care if they're slow. I do care about things like access databases, though, so figuring out what my 'active set' actually is will take some figuring.
Long story short: With OES2 and 64 bit hardware, I bet I could actually use a machine with 18GB of RAM!
Labels: benchmarking, novell, NSS, OES
Thursday, March 29, 2007
Why cache is good
One test I did underlines the need to tune your cache correctly. Using the same iozone tool I've used in the past, I ran the throughput test with multiple threads. Three tests:
20 threads processing against a separate 100MB file (2GB working set)
40 threads processing against a separate 100MB file (4GB working set)
20 threads processing against a separate 200MB file (4GB working set)
The server I'm playing with is the same one I used in September. It is running OES SP2, patched as of a few days ago. 4GB of RAM, and 2x 2.8 P4 CPU's. The data volume is on the EVA 3000 on a Raid0 partition. I'm testing OES througput not the parity performance of my array. Due to PCI memory, effective memory is 3.2GB. Anyway, the very good table:
20x100M 40x100M 20x200MThe 2GB dataset fit inside of memory. You can see the performance boost that provides on each of the Read tests. It is especially significant on the tests designed to bust read-ahead optimization such as Reverse Read, Stride Read, and Random Read. The Mixed Workload test showed it as well.
Initial write 12727.29193 12282.03964 12348.50116
Rewrite 11469.85657 10892.61572 11036.0224
Read 17299.73822 11653.8652 12590.91534
Re-read 15487.54584 13218.80331 11825.04736
Reverse Read 17340.01892 2226.158993 1603.999649
Stride read 16405.58679 1200.556759 1507.770897
Random read 17039.8241 1671.739376 1749.024651
Mixed workload 10984.80847 6207.907829 6852.934509
Random write 7289.342926 6792.321884 6894.767334
One thing that has me scratching my head is why Stride Read is so horrible with the 4GB data-sets. By my measure about 2.8GB of RAM should be available for caching, so most of the dataset should fit into cache and therefore turn in the fast numbers. Clearly, something else is happening.
Anyway, that is why you want to have a high cache-hit percentage on your NSS cache. This is also why 64-bit memory will help you if you have very large working sets of data that your users are playing on, and we're getting to the level where 64-bit will help. And will help even though OES NCP doesn't scale quite as far as we'd like it to. That's the overall question I'm trying to answer here.
Labels: benchmarking, novell, NSS, OES, storage
Monday, March 26, 2007
BrainShare done
Also next week when class is back in I need to analyze our I/O patterns on WUF to better design a test for OES. I need to know FOR SURE if OES-Linux is up to the task of handling 5000 concurrent connections the way we do it. The last series suggested it, but I need more details.
Labels: benchmarking, brainshare, novell
Monday, March 19, 2007
TUT212: Novell Storage Services
By far the biggest thing is a 64-bit version of OES. Big big big. How big? Very big.
Remember those benchmarks I ran? The ones that compare the ability of OES to keep up with NetWare? And how I learned that on OES NCP operations are CPU bound w-a-y more than on NetWare? That may be going away on 64-bit platforms.
You see, 64-bit linux allows the Kernel to have all addressable memory as kernel memory. 32-bit linux was limited to the bottom 1GB of RAM. If NSS is allowed to store all of its cache in kernel memory, it'll behave exactly like 32-bit NetWare has done since NSS was introduced with NetWare 5.0. I have very high hopes that 64-bit OES will solve the performance problems I've had with OES.
Labels: benchmarking, brainshare, netware, novell, OES
Wednesday, October 11, 2006
MSA Performance update
- RAID stripe performance (standard IOZONE, and a 32GB file IOZONE)
- 64K both Raid0 and Raid5
- Default stripes: 16K Raid5, and 128K Raid0
- Versus EVA performance
- Software mirror performance (software Raid1)
- Windows/NetWare: MSA/EVA
Windows: MSA/MSA?? Windows: EVA/EVA- Concurrency performance
- Multiple high-rate streams to the same Disk Array (different logical drives)
- Multiple high-rate streams to different Disk Arrays
- Random I/O & Sequential I/O performance interaction on the same array
One thing became very, very clear when testing the default stripe sizes. A 16KB stripe size on a RAID5 array on the MSA gives faster read performance, but much worse Write performance. Enough worse, that I'm curious why it's a default. We'll be going with a 64K stripe for our production use, as that's a good compromise between read/write performance.
The Windows part of the mirror/unmirror test is completed. Write performance tracks, as in the curve has the same shape, the MSA performance. This makes sense, because software mirroring needs to have both writes commit before it'll move on to the next operation. This by necessity forces write performance to follow the slowest performing storage device. All in all, Write performance trailed MSA performance, which in turn trailed EVA performance for the large file test.
Read performance is where the real performance gains were to be had. This also makes sense because software Raid1 generally has each storage device alternating serving blocks. On reflection this could play a bit of hob with in-MSA or in-EVA predictive reads, but testing that is difficult. Performance matched EVA performance for files under 8GB in size, and still exceeded MSA performance for the 32GB file.
I'm running the NetWare test right now. Because this has to run over the network, I can't compare these results to the Windows test. But I can at least get a feeling for whether or not NetWare's software mirror provides similar performance characteristics. Considering how slow this test is running (Gig Ether isn't having as much of an impact as I thought it would), it'll be next week before I'll have more data.
Because of the delays I'm seeing, I've had to strike a few tests from the testing schedule. This needs to be in production during Winter Break, so we need time to set up pre-production systems and start building the environment.
Tags: msa, benchmarking
Labels: benchmarking, msa, storage
Wednesday, October 04, 2006
More MSA performance
The testing series I've worked out is this:
- RAID stripe performance (standard IOZONE, and a 32GB file IOZONE)
- 64K both Raid0 and Raid5
- Default stripes: 16K Raid5, and 128K Raid0
- Versus EVA performance
- Software mirror performance (software Raid1)
- Windows/NetWare: MSA/EVA
- Windows: MSA/MSA
- ?? Windows: EVA/EVA
- Concurrency performance
- Multiple high-rate streams to the same Disk Array (different logical drives)
- Multiple high-rate streams to different Disk Arrays
- Random I/O & Sequential I/O performance interaction on the same array
One thing the testing has already shown, and that is for Raid5 performance a quiescent MSA out-performs the in-production EVA. Since there is no way to do tests against the EVA without competing at the disk level for I/O supporting production, I can't get a true apples to apples comparison. By the numbers, EVA should outperform MSA. It's just that classes have started to the EVA is currently supporting the 6 node NetWare cluster and the two node 8,000 mailbox Exchange cluster, where the MSA is doing nothing but being subjected to benchmarking loads.
The other thing that is very apparent in the tests are the prevalence of caching. Both the host server and the MSA have caching. The host server is more file-based caching, and the MSA (512MB) is block-level caching. This has a very big impact on performance numbers for files under 512MB. This is why the 32GB file test is very important to us, since that test blows past ALL caching and yields the 'worst case' performance numbers for MSA.
Tags: msa, benchmarking
Labels: benchmarking, msa, storage
Monday, October 02, 2006
Performance of the MSA
One of the tests I ran was to do a full IOZONE series on a 32GB file. This is to better get a feel for how such large files perform on the MSA, since I suspect that any backup-to-disk system will be generating files that large. But I got some s-t-r-a-n-g-e numbers. It turns out that the random-write test is much faster than the random-read test. Weird.
| RandomR | |||
| Rec KB | 2048 | 4096 | 8192 |
| Thru | 10881 | 17115 | 23311 |
| RandomW | |||
| Rec KB | 2048 | 4096 | 8192 |
| Thru | 64491 | 63949 | 62681 |
So, um. Yeah. And you want to know the scary part? This holds true for both a Raid0 and Raid5 array. Both have a 64K stripe size, which is not default. Raid5's default stripe is 16K, and Raid0 is 128K. I'll test the default stripes next to see if they affect the results any. But this is STILL weird.
Perhaps writes are cached and reordered, and reads just come off of disk? Hard to say. But read speed does improve as the record size increases. The 16MB record size turns in a read speed of only .5 that of the write speed. Yet the read performance at 64K is .12 that of write. Ouch! I'm running the same test on the EVA to see if there is a difference, but I don't know what the EVA stripe-size is.
Tags: benchmarking, MSA
Labels: benchmarking, msa, storage
Tuesday, September 19, 2006
Results: Conclusions
I was testing the performance of an NSS volume mounted over NCP. In part this is because NetWare clustering only works with NSS, but mostly because of two other reasons. The only other viable file-server for Linux is Samba, and I already know it has 'concurrency issues' that crop up well below the level of concurrency we show on the WUF cluster. Second, the rich meta-data that NSS provides is extensively used by us. I don't believe any Linux file system has an equivalent for directory quotas.
Hardware
- HP ProLiant BL20P G2
- 2x 2.8GHz CPU
- 4GB RAM
- HP EVA3000 fibre attached
- NetWare 6.5, SP5 (a.k.a. OES NetWare SP2)
- N65NSS5B patch
- nw65sp5upd1
- 200GB NSS volume, no salvage, RAID0, on EVA3000
- OES Linux SP2
- Post-patches up to 9/12/06
- 200GB NSS volume, no salvage, RAID0, on EVA3000
To facilitate the testing I was granted the use of one of the computer labs on mothballs between terms. This lab had 32 stations in it, though only 30 stations were ever used in a test. I thank ATUS for the lending of the lab.
Client Configuration
- Windows XP Sp2, patched
- P3 1.6GHz CPU
- 256MB RAM
- Dell
- Novell Client version 4.91.2.20051209 + patches
- NWFS.SYS dated 11/22/05
Unfortunately, the Linux configuration hits its performance ceiling well before the NetWare server does. Linux just doesn't scale as well as NetWare. I/O operations on Linux are much more CPU bound than on NetWare, as CPU load on all tests on the Linux server was excessive. The impact of that loading was very variable, though, so there is some leeway.
Both of the file-create and dir-create tests created 600,000 objects in each run of the test. This is a clearly synthetic benchmark that also happened to highlight one of the weaknesses of the NCP Server on Linux. During both tests it was 'ndsd' that was showing the high load, and that is the process that handles the NCP server. Very little time was spent in "IO WAIT", with the rest evenly split between USER and SYSTEM.
The IOZONE tests also drove CPU quite high due to NCP traffic, but it seems that actual I/O throughput was not greatly affected by the load. In this test it seems that Linux may have out-run NetWare in terms of how fast it drove the network. The difference is slight, a few percentage points, but looks to be present. I regret not having firm data for that, but what I do have is suggestive of this.
But what does that mean for WWU?
The answer to this comes with understanding the characteristics of the I/O pattern of the WUF cluster. The vast majority of it is read/write, with create and delete thrown in as very small minority operations. Backup performance is exclusively read, and that is the most I/O intensive thing we do with these volumes. There are a few middling sized Access databases on some of the shared volumes, but most of our major databases have been housed in the MS SQL server (or Oracle).
For a hypothetical reformat of WUF to be OES-Linux based, I can expect CPU on the servers doing file-serving to be in the 60-80% range with frequent peaks to 100%. I can also expect 100% CPU during backups. This, I believe, is the high end of the acceptable performance envelope for the server hardware we have right now. With half of the nodes scheduled for hardware replacement in the next 18 months, the possibility of dual and even quad-core systems becomes much more attractive if OES Linux is to be a long term goal.
OES-Linux meets our needs. Barely, but it does. Now to see what OES2 does for us!
Tags: novell, benchmarking
Labels: benchmarking, novell
Monday, September 18, 2006
Results: IOZONE and throughput tests
With the throughput tests, there were no perceivable differences between 16 simultaneous threads and 32 simultaneous threads. The NetWare throughput test showed signs of client-side caching as well, so those results are tainted. Plus I learned that there were some client-side considerations that impacted the test. The clients all had WinXP SP2 in 256MB of RAM, and instantiating 16 to 32 simultaneous IOZone threads causes serious page faults to occur during the test.
As such, I'm left with much more rough data from these tests. CPU load for the servers in question, network load, and fibre-channel switch throughput. Since these didn't record very granular details, the results are very rough and hard to draw conclusions from. But I'll do what I can.
At the outset I predicted that these tests would be I/O intensive, not CPU intensive. It turns out I was wrong for Linux, as CPU loads approached those exhibited by the dir-create and file-create tests for the whole iozone run. On the other hand, the data are suggestive that the CPU loading did not affect performance to a significant degree. CPU load on NetWare did approach 80% during the very early phases of the iozone tests, when file-sizes were under 8MB, and decreased markedly as the test went on. It was during this time that the highest throughputs were reported on the SAN.
Looking at the network throughput graphs for both the lab-switch uplink to the router core and the NIC on the server itself suggest that throughput to/from OES-Linux was actually faster than OES-NetWare. The difference is slight if it is there, but at a minimum both servers drove an equivalent speed of data over the ethernet. Unfortunately, the presence of client-side caching on the clients for the NetWare run prevent me from determining the actual truth of this.
On the fibre-channel switch attached to the server and the disk device (an HP EVA) I watched the throughputs recorded on the fibre ports for both devices. The high-water mark for data transfer occurred during the first 30 minutes of the iozone run with NetWare, the Linux test may have posted an equivalent level but that test was ran during the night and therefore its high-water mark was unobserved. At the time of the NetWare high-water mark all 32 stations were pounding on the server with file-sizes under 16MB. The level posted as 101 MB/s (or 6060 MB/Minute), which is quite zippy. This transfer rate coincided quite well with the rate observed on the ethernet. This translates to about 80% utilization on the ethernet, which is pretty close to the maximum expected throughput for parallel streams.
For comparison, the absolute maximum transfer rate I've achieved with this EVA is 146 MB/s (8760 MB/Min). This was done with iozone running locally on the OES-Linux box and TSATEST running on one of the WUF cluster nodes backing up a large locally mounted volume. Since this setup involved no ethernet overhead, it did test the EVA to its utmost. It was quite clear that the iozone I/O was contending with the TSATEST data, as when the iozone test was terminated the TSATEST screen reported throughput increasing from 830 MB/Min to 1330 MB/Min. I should also note that due to the zoning on the Fibre Channel switch, this I/O occurred on different controllers on the EVA.
These tests suggest that when it comes to shoveling data as fast as possible in parallel, OES-Linux performs at a minimum the equivalent of OES-NetWare and may even surpass it by a few percentage points. This test tested modify, read, and write operations, which except for the initial file-create and final file-delete operations are metadata-light. Unlike file-create, the modify, read, and write operations on OES-Linux appear to not be significantly impacted by CPU loading.
Next, conclusions.
Tags: novell, benchmarking
Labels: benchmarking, novell
Results: create operation differences
 I just put the Min values in the error bars to make it a cleaner graph. But here you can see the trend mentioned in the file-create tess about the 4000 object line. Only here 4500 objects seems to be the point where file-create passes dir-create in terms of time per operation. This is a result of CPU usage and the fact that file-create appears to be more affected by it than NetWare is. The idential NetWare chart is illustrative, but since CPU never went above 70% for more than a few moments it isn't a pure apples-to-apples comparison.
 In this case, file-create remains below dir-create for the whole run. What's more, dir-create drove CPU a lot harder than file-create did. The early data in the Linux run shows that OES-Linux would follow this file-create-is-faster pattern given sufficient CPU.
Exactly why file-create performance degrades so fast when CPU contention begins is unclear me. In terms of disk bandwidth, all four tests barely twitched the needle on the SAN monitor; these tests do not involve big I/O transfers. As far as NSS is concerned, a directory and a file are very similar objects in the grand scheme of things. Yet NSS seems to track more data related to directories than files, so it seems counter intuitive that file-create would lag when CPU becomes a problem. This question is one I should bring with me to BrainShare 2007.
Next, IOZONE and throughput tests.
Tags: novell, benchmarking
Labels: benchmarking, novell
Results: file-create
30 workstations create a sub-directory, and in that sub-directory create 20,000 files. At each 500 files it does a directory listing and times how long it takes to retrieve the list. A running total of the time taken to create files is kept, and a log of how long each entry takes to create is also kept.
 This chart is interesting in several ways. First of all, note the lower error bars for the Linux line. Those bars overlap and up to about 4000 files actually is below the NetWare average. This says to me that when there is CPU room, Linux may be faster than NetWare when responding to file creates. This particular line was caused by the same method as the previous test, namely that some test stations started up to 30 seconds before the whole group was running and therefore had a window of uncontended I/O. Those same workstations finished their tests while others were still around 12000 files, which further explains the downward trend of the Linux line above that threshold.
The second interesting thing is the sheer variability of the results. As with the dir-create test, CPU was completely utilized on the OES-linux box. The reported load-averages were very similar to dir-create. Some test workstations were able to run a complete test before others even got to 12000 files. Yet others took a really long time to process. The file-create test ran well over an hour, where the same test on NetWare took just under 30 minutes.
 This graph shows significant differences between the two platforms. As with the first chart, 4000 directories and under some workstations turned in NetWare-equivalent response times when speaking to OES-Linux. As with the above, this was due to uncontended I/O. But once all the clients started running the test the response time for directory enumeration was greatly degraded.
Because file-create seems to clog the I/O channels more than dir-create did, directory enumeration had to compete in the same channels and thus response times suffered. Towards the end of the test when some workstations had finished early response times were creeping back towards parity with OES-NetWare.
Next, create operation differences.
Tags: novell, benchmarking
Labels: benchmarking, novell
Friday, September 15, 2006
Results: dir-create
The Test:
30 workstations create a sub-directory, and in that sub-directory create 20,000 directories. At each 500 directories it does a directory listing and times how long it takes to retrieve the list. A running total of the time taken to create directories is kept, and a log of how long each entry takes to create is also kept.
This chart shows it very well. As I've said before, the state of the server affected this run. At its peak, the NetWare server had a CPU load around 65%. The Linux server had a load average around 18, which roughly translates to a CPU load of 900%. Directory Create is an expensive operation due to the amount of meta-data involved. This is clearly much more expensive on the Linux platform than it is on the NetWare platform.
The range of results is also quite interesting. Generally speaking, when speaking to a NetWare server the clients had a pretty even spread of response times. Time were faster than others. It just happens. Because of testing limits I was not able to start all stations at exactly the same time; however, start-time was within 30 seconds of eachother. The stations that went first recorded really good times for the first 3000 directories or so then slowed down as everyone got going. This effect was quite clear in the raw Linux data, though it is hidden in the above chart.
A side effect of that is that when the fast clients finished, it removed some of the I/O contention going on. You can see that in the downward curve of the Linux line towards the end of the test. That doesn't indicate that Linux was getting better at higher speeds, just that some clients had finished working and had removed themselved from the testing environment.
This is the chart that describes how long it takes to enumerate a single directory inside of a dir-list of the created sub-directory. As the test progressed there were more directories to enumerate. Mere enumeration isn't an expensive operation, as it just involved a sub-set of the metadata involved in the directory-entries. As with the dir-create test, dir-enum shows that Linux is slower on the ball than NetWare is under heavy load conditions. This is pretty clearly CPU related, as a single client running these tests shows very little difference between the platforms.
The hump and fall-off of the Linux line is an artifact of faster workstations getting done quicker and getting out of the way. The sheer variability of the linux line is interesting in and of itself. I'm sure further testing may identify the cause of that, but I'm limited on time and other resources so I won't be investigating it now.
Next, on Monday, file-create and file-enumerate.
Tags: novell, benchmarking
Labels: benchmarking, novell
Thursday, September 14, 2006
Testing completed
But, I figured I'd give some impressions I got from the tests. For brevity purposes, when I say NetWare I mean, "OES NetWare 6.5 SP3 with patches up to 8/23/06", and when I say Linux, I mean, "OES Linux SP2, with patches up to 9/1/06". Also, when talking about I/O, I'm referring to, "I/O performed over the network via NCP to an NSS volume."
- I/O on Linux is more CPU bound than on NetWare. For absolute sure, dir-create and file-create are much more expensive operations CPU-wise. They both perform similarly when done with unloaded systems, but the system hit for create on Linux is much higher than on NetWare. This could be due to System/User memory barriers, but my testing isn't robust enough to test that sort of thing. NetWare is all Ring 0, where by necessity Novell has brought a lot of the file-sharing functions in Linux into Ring 3.
- Bulk I/O speed is similar. When talking about bulk I/O functions, in my case this was the IOZONE test, both platforms perform similarly. Unfortunately, caching played a big role on the NetWare test and didn't perform any role in the Linux test. This is the inverse of my findings in January. The testing gods frowned on me.
- Linux seems to support faster network I/O than NetWare. Unfortunately, this may just be a side-effect of the caching. But network loads were higher when running the bulk IO tests on Linux than they were with NetWare. This can be a good thing (Linux supports more network I/O than NetWare) or a bad thing (Linux requires more network I/O for similar performance). Not sure at this time which it is.
Another thing to note is that the bulk IO test with IOZONE also induced very high load-averages on Linux, but the apparent throughput was very comparable to NetWare. IOZONE works by creating a file of size X and runs a series of tests on records of size Y. Unlike the dir-create and file-create tests, this test doesn't test how fast you can create files it tests how fast you can get data. Clearly record I/O within files still induces CPU load in the form of NDSD activity; however, unlike the dir-create and file-create tests the apparent throughput is not nearly as affected by high-CPU conditions.
From this early stage it looks like we could convert WUF to Linux and still not need new hardware. But we'd be running that hardware harder, much harder, than it would have run under NetWare. Since we're not pushing the envelope with our NetWare servers now, we have the room to move. If our servers were running closer to 20% CPU, the answer would be quite different.
As I read the documentation, it looks like NCPserv is a function of ndsd. Therefore, seeing ndsd taking up CPU cycles that way was due to NCP operations, not DS operations. If that's the case, substituting a reiser partition for the NSS partition would decrease CPU loading some, but probably not the order of magnitude it needs.
Tags: novell, benchmarking
Labels: benchmarking, novell
Wednesday, September 13, 2006
return of.. part 2
Unfortunately, we seem to have an 'apples to apples' problem. While the network utilization appears to be higher with the OES Linux server, implying better throughputs, it is clear from the few clients that have finished the run that there was no caching involved with this particular test. Comparing numbers, therefore, will be a bear.
Ideally I'd rerun the NetWare test with client caching and oplock 2 disabled, but I don't have time for that. This server needs to be given back to the service I borrowed it from.
Tags: novell, benchmarking
Labels: benchmarking, novell
Tuesday, September 12, 2006
return of differences.
Okay, it turned 'warning'. Before it was either green/working, or red/broken. They'd never seen yellow/high-load before. They were quite happy.
Anyway... the 1GB link between the lab with all the workstations and the router core was running 79-81% utilization. Nice!
On the san link we had around 20% utilization, the highest I'd ever seen the EVA drive before.
Right now I can't tell what that link is running, but the link into the server itself is running in the 50-60% range. Better analysis will occur tomorrow when I can ask the Telecom guys how that link behaved overnight. As for the server, load-levels are well above 3.0 again. Right at this moment it's at 14ish, with ndsd being the prime process.
At this point I'm begining to question what unix load-averages mean when compared to the cpu-percentage reported by NetWare. Are they comparable? How does one compare? Anyway, the dir-create and file-create tests did showed to be much more cpu-bound on Linux than NetWare, and this sort of bulk I/O seems to have a similar binding. Late in the test CPU on NetWare was fairly low, 20% range, with the prime teller of loading being allocated Service Processes. So I'm pretty curious as to what load will look like when all the stations get into the 128MB file sizes and larger.
Tags: novell, benchmarking
Labels: benchmarking, novell
differences continued
I haven't looked at the data closely yet, but I suspect that the same trends reported in the dir-create test follow here. I didn't do a test for dir-create and file-create on NetWare with a smaller number of stations, but then it didn't seem like I needed to. The 'break even' point, where CPU is just under 100%, on the dir-create looks to be in the 4-6 station range, with the file-create point on or around 10 stations.
Tags: novell, benchmarking
Labels: benchmarking, novell
Monday, September 11, 2006
differences bloom
Test 1 is the 'big directory' test. The client stations create 20,000 sub directories in a sub-directory titled the name of the machine. The time to create each directory is tracked, and the time it takes to enumerate each directory is also tracked. In testing out the benchmark it is clear that mkdir is a more expensive operation than 'touch' is in the make-file test (also 20,000 files).
On NetWare with 30 client machines pounding the server, CPU rose to about 80% or so and stayed there. Load on the CPUs were equal. There was some form of bottlenecking going on because some clients finished much faster than others, and it isn't clear what separated the two classes.
On Linux the load-average is pretty stable around 18. The process taking up that CPU is ndsd. The numbers I'm getting back from the clients are vastly worse than NetWare. The first time I ran it I figured that this was due to the workstation objects not having the posixAccount extension. So I fixed that, and now the percentages are better, but still much worse than NetWare. I'll run this test again with only 10 clients, so I get to compare smaller concurrent access numbers.
That kind of load is not exactly 'real user load', it's a synthetic load designed to show how well either platform handles abuse. The iozone benchmark should be closer to comparable since that's just a single file, and ndsd shouldn't be involved with those accesses much at all. That'll be almost entirely i/o subsystem.
Tags: novell, benchmarking
Labels: benchmarking, novell
Friday, September 08, 2006
progressing
iozone -Rab \report-dump\IOZONE-std\%COMPUTERNAME%-iozone1.xls -g 1G -i 0 -i 1 -i 2 -i 3 -i 4 -i 5
Right now all the stations are chewing on the 1GB file, and are all at various record-size stages. But the fun thing is the "nss /cachestats" output:
BENCHTEST-NW:nss /cachestatYep. All that I/O is only partially being satisified by cache-reads. As it should be at this stage of the game.
***** Buffer Cache Statistics *****
Min cache buffers: 512
Num hash buckets: 524288
Min OS free cache buffers: 256
Num cache pages allocated: 414103
Cache hit percentage: 63%
Cache hit: 3407435
Cache miss: 1978789
Cache hit percentage(user): 60%
Cache hit(user): 3031275
Cache miss(user): 1978789
Cache hit percentage(sys): 100%
Cache hit(sys): 376160
Cache miss(sys): 0
Percent of buckets used: 48%
Max entries in a bucket: 7
Total entries: 399112
What surprised me yesterday when I kicked off this particular test was how baddly hammered the server was at the very begining. This is the small file-size test, and better approximates actual usage. CPU during the first 30 minutes of the test was in the 70-90% range, and was asymetric, CPU1 was nearly pegged. During that phase of it we also drove a network utilization of 79-83% on the GigE uplink from the switch serving the testing machines and the router core. And on the Fibre Channel switch serving the test server, the high-water mark for transfer speed was 101 MB/Second (~20% utilization).
The FC speed is notible. The fasted throughput I was able to produce on the port linking the EVA was about 25 MB/Second, and that was done with TSATEST running against local volumes in parallel on three machines. Clearly our EVA is capable of much higher performance than we've been demanding of it. Nice to know.
Depending on how the numbers look once this test is done, I might change my testing procedure a bit. Run a separate 'small file' run in IOZone to capture the big-load periods, and perhaps a separate 'big file' run with 1G files to capture the 'cache exhaustion' performance.
From a NetWare note, the 'Current MP Service Processes' counter hit the max of 750 pretty fast during the early stages of the test. Upping the max to 1000 showed how utilization of service processes progressed during the test. Right now it's steady at 530 used processes. Since I don't think Linux has a similar tunable parameter, this could be one factor making a difference between the platforms.
Tags: benchmarking, novell
Labels: benchmarking, novell
Wednesday, September 06, 2006
Technology is cooooool
Anyway, the trick:
- Make sure all the clients are imported as Workstation Objects.
- Create a Workstation Group, and add all of the clients into it.
- Add the newly created Workstation Group as a R/W trustee of the volume I'm benchmarking against. This allows the workstations as themselves, not users, to write files.
- Create a Workstation Policy, associate it to the group.
- In the Workstation Policy, create a Scheduled Task. Point it at the batchfile I wrote that'll map a drive to the correct volume, run the tests, and clean up.
- Modify the schedule so it'll run at a specific time, making sure to uncheck the 'randomize' box.
- Force a refresh of the Policies on the clients (restarting the Workstation Manager service will do it).
The jobs all seem to start within 30 seconds of the scheduled time. This doesn't seem to be due to differences in the workstation clocks, on checking those are all within 3 seconds of 'true', rather the Workstation Manager task polling interval. I wish I could get true 'everyone right now' performance, but that's not possible without w-a-y more minions.
On the 'large number of sub-directories' test, the early jumpers seemed to get a continued edge over their late starters. The time to create directories for the early jumpers was consistantly in the 3-5ms range, where the late jumpers were in the 10-13ms range. Significant difference there. And some started fast and became slow, so there is clearly some threshold involved here beyond just the server dealing with all those new directory entries. CPU load on the NetWare box (what I have staged up first) during the test with 32 clients creating and enumerating large directories was in the 55-70% range. That load is spread equally over both CPUs, so those bits of NSS are fully MP enabled.
Tags: benchmarking, zenworks
Labels: benchmarking, zenworks
Thursday, August 31, 2006
Math is hard
- The timer I'm using has some math in it that made me miss decimal places. Oops.
- Small bug where I was retrieving the directory list the same number of times as the stepping facter. Give a stepping factor of 500, and it'll grab the dir list 500 times. Oops.
- After retrieving the time taken to grab the directory list I divided that by the stepping factor. Then the total number of entries it retrieved. It should have been just divided by the number of entries retrieved. Oops.
Tags: benchmarking
Labels: benchmarking
Benchmark observations
- MKDIR seems to be more server-CPU intensive than TOUCH by quite a bit. During the long MKDIR test CPU was noticibly higher than ambient, but the TOUCH test barely twitched the needle. Hmmm.
- MKDIR is a faster operation than TOUCH, from a client's perspective.
- Directories are faster to enumerate than files.
- Enumeration operations are sensitive to network latency. When the client is busy, enumeration gets noiser.
- Both create and enumerate are sensitive to client CPU loads.
- Enumeration is much faster than create, by about four orders of magnitude.
- At least Directory Create time does trend upwards over time depending on how many objects are in the parent directory. Though this is is only really visible when going well above 100,000 directories, and is very slight; 2.049ms at 2000 dirs and 2.4159ms at 500K dirs. Haven't tested files yet.
Tags: benchmarking
Labels: benchmarking
Perhaps not?
Though, I wonder if files yield different results?
And, doh, I bet I'll get different results when running against a Windows server than a NetWare one. Heh. We'll see.
Tags: benchmarking
Labels: benchmarking
Wednesday, August 30, 2006
That was easier than I thought...
Some sample output:
Iterations, MkDirOpTime(ms), EnumerationTimeDOS(ms), EnumerationOpTimeDOS(ms)
500, 0.213460893024992, 4.33778808035625, 0.0086755761607125
1000, 0.205388901117948, 8.56917296772817, 0.00856917296772817
1500, 0.206062279938047, 12.6200889185171, 0.00841339261234476
2000, 0.203543292746338, 16.5182862916397, 0.00825914314581986
2500, 0.202069268714127, 20.5898861176478, 0.00823595444705914
3000, 0.201296393468305, 24.786919106575, 0.00826230636885834
That's 3000 directories being enumerated in that bottom line. I'm also not 100% on the time unit being miliseconds, though the same operation converts the arbitrary (?) system units into real units for all of those.
The utility takes two arguments:
- Number of directories to create.
- [optional] Stepping factor.
Tags: benchmarking
Labels: benchmarking
Tuesday, August 29, 2006
Getting ready for a benchmark
Right now I'm looking to test two things:
- NCP performance to an NSS volume from a Windows workstation (iozone)
- Big directory (10,000+ entries) performance over NCP (tool unknown)
- Large scale concurrent connection performance test. Essentially, the NCP performance test done massively parallel. Over 1000 simultanious connections. Our cluster servers regularly serve around 3000 simultanious connections during term, and I really want to know how well OES-Linux handles that.
- Scaled AFP test. This requires having multiple Mac machines, which I don't have access to. We have a small but vocal Mac community (all educational institutions do, I believe), and they'll notice if performance drops as a result of a theoretical NetWare to Linux kernel change.
- Any AFP test at all. No mac, means no testy testy.
- NCP performance to an NSS volume from a SLED10 station. I don't have a reformatable test workstation worth beans that can drive a test like this one, and I don't trust a VM to give consistent results.
This may require me to write custom code, which I'm loth to do but will do if I have to. Especially since different API calls can yield different results on the same platform, and I'm not programmer enough to be able to be certain which API call I'm hooking is the one we want to test. This is why I'd like to find a pre-built tool.
If you have something that you'd like tested, post in the comments. It may actually happen if you include a pointer to a tool that'll measure it. Who knows?
Tags: novell, benchmarking
Labels: benchmarking, novell
Thursday, January 26, 2006
Benchmark results summary
Server Hardware:The performance tests were performed with IOZONE over the network. As you would expect, certain tests were constrained by network performance, but the data was rich enough to draw conclusions from all levels of file size.
HP ProLiant BL20, G3
2x 3.2GHz Cpu
2GB RAM
2x 72GB U320 HD, RAID1
Hyperthreading off
100MB Ethernet port
Client Info:
3.00GHZ CPU
1GH RAM
Novell Client 4.91.0.20050216
100MB Ethernet port, different subnet from server
WinXP,SP2 fully patched
Switched ethernet between Server and Client
NetWare Config
NetWare 6.5 SP4a (a.k.a. OES-NW SP1)
No post-SP4a patches
No changed NSS settings
No Proliant RomPaq applied (i.e. Novell supplied drivers, not HP-supplied)
10GB NSS volume
Purge-Immediate flagged in test directory
OES-Linux Config
OES-Linux SP1
Novell Samba
No post-patches (risky, I know, but best apples-to-apples since SP2 was on the Red Carpet servers)
10GB NSS Volume
Purge-Immediate flagged in test directory
These tests were done such that only my I/O was being handled by the servers. I don't have the resources to check out how the two platforms and protocols handle high levels of contention. That'll have to be handled by people other than me.
Part 1: Caching
Part 2: CIFS
Part 3: NCP
Part 4: Comparing Cache, NCP-on-Linux vs CIFS-on-NetWare
Part 5: Comparing Uncached, NCP-on-NetWare vs CIFS-on-Linux
Part 6: Conclusions so far
Part 7: Uncached NCP
Part 8: NCP vs CIFS on Linux
The Bottom Line
NCP-on-Linux is the best bet. This is a surprising result, but it goes to show that Novell has done a good job in porting over NCP onto the Linux platform. I did not expect to find that NetWare was second to Linux for file-serving over Novell's 20 year old file serving protocol. The improvement for running NCP clients against a Linux server was not jaw dropping, only single digit improvements, but the fact that it is better at all says something right there.
And as a bonus, the data I drew it all from!
Labels: benchmarking, netware, OES
Benchmark results part 8: NCP vs CIFS on Linux
Since I now have data runs for both protocols that do not include client-side caching, this comparison should be a lot easier. So far we have learned that NCP overall is better than CIFS for the kinds of file-access our users do most. I expect this to show here as well. Earlier tests showed that NCP-on-Linux (cached) is better than CIFS-on-NetWare (cached), and NCP-on-Linux (uncached) is better than NCP-on-NetWare (uncached). Since I've already shown that NCP-on-NetWare is better than CIFS-on-Linux, and NCP-on-Linux is better than NCP-on-NetWare, it is a foregone conclusion that CIFS-on-Linux will be worse than NCP-on-NetWare.
But by how much? Same OS back end for the two, so lets go see!
Write Tests
The Write test turned in an overall performance increase of 17% for using NCP versus CIFS. Like the previous NCP vs. CIFS comparisons, the differences in performance are very visible in the Record Size scale. The 4K record size shows a performance increase of 97%, 8K at 95%, 16K at 59%, 32K at 44%, and 64K at 13%. After 64K CIFS starts performing better. Each progressive record size up to 16M gets a little bit worse for NCP, until it gets to 16M and has a performance hit of -13%. The file-sizes show a similar but flatter curve, with the inflection between NCP vs CIFS occurring between the 16M and 32M file-sizes. The 64K files perform 75% faster, and the 512M files perform 6% slower.
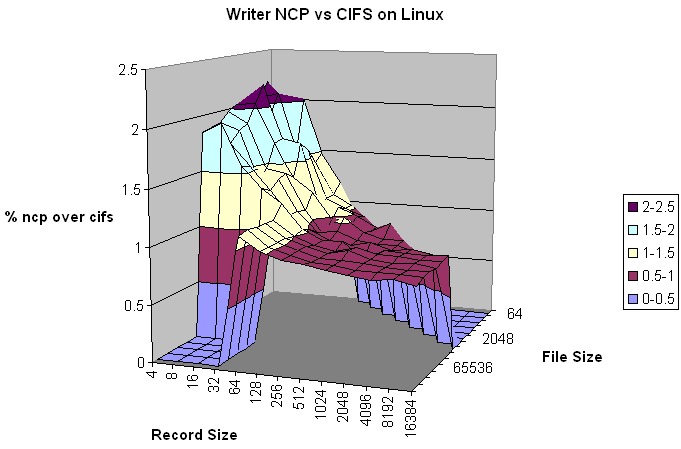
The ski-jump look of the graph shows it all right there. As with the previous NCP vs CIFS, file-size doesn't have a LOT to do with performance, but it does have an impact. The slope of the 4K line shows that the larger file-sizes probably wouldn't be able to match NCP's performance for the smaller files.
The Re-Writer test showed an overall improvement of NCP over CIFS by 16%, a bit lower than the Writer performance. This was also reflected in the record-size and file-size performances. The movement isn't great, but it does suggest that CIFS contains slightly better metadata-handling than NCP.
The Random Write test showed an overall improvement of NCP over CIFS by 4%. The reason for the poorer showing is that NCP's small record-size performance that did so well in the Writer and Re-Writer tests, isn't nearly as good on this test. The same ski-jump is visible in the graph, but not to the same slope.
The Record Rewrite test showed an overall improvement of NCP over CIFS by 6%. Like the Random Write test, NCP wasn't able to show the stellar performance at the smaller record-sizes that it showed on the Write test. The inflection point is between the 64K and 128K record-sizes.
Read Tests
The Reader test turned in an average performance boost for using NCP of 6%. Like the earlier test comparing CIFS-on-Linux to NCP-on-NetWare, there isn't a strong correlation with record-size and performance.
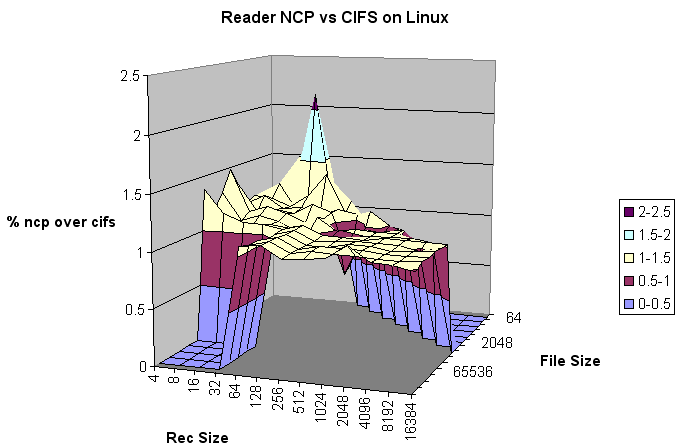
The performance was almost entirely better than CIFS, but in many cases only by a few percentage points.
The Re-Reader test performed much the same as the Reader test, and posted a performance increase of only 5%. Like the re-writer test, this is probably due to better meta-data handling in CIFS than with NCP. The data looks much like the Reader chart in shape and form.
The Random Read test posted a performance boost of 4%. NCP performed a bit better (up to 9%) at the smaller record sizes, but overall performance was generally just a few points above the break-even line.
The Backward Read test turned in a performance boost of 5%. As with most CIFS tests, NCP performed better at smaller record sizes. As with the Random Read test, performance was overall better than CIFS by only a few points on most of the chart.
Conclusions
While CIFS has NCP beat on writes to large files, NCP has CIFS beat on reads. This matches earlier results. In fact, NCP-on-Linux is better than NCP-on-NetWare enough that the large file reads are now above the 1.00 line. Novell has done a good job getting NCP ported to Linux.
Which protocol to use depends on what you are going to use the server for. For general office file-server usage, NCP is by far the better protocol. For GIS, large DB, or other large media files, CIFS probably is the better choice in those cases. In our case, though, NCP's access patterns fit our usage patterns better.
Summary
Labels: benchmarking, netware, novell, OES
Benchmark results part 7: Uncached NCP, Linux vs NetWare
The run is complete, and I now have a true apples-to-apples comparison of NCP performance. The result is a rather surprising one! In every single test, NCP-on-Linux out-performed NCP-on-NetWare. The lowest margin was 1%, and the highest margin was 9%, so the advantage isn't stellar. On the other hand, NCP started life on NetWare so you would expect it to do better on that platform.
T'ain't so.
One small trend did show up in the test data. Tests that involved a write component showed a slight, 1-3%, increase over the NetWare data. Tests that involved a read component showed a little better performance, 6-8%. The reasons for this are unclear, but it is very consistent.
Write Tests
The Writer test showed the best performance gain in the range of file-sizes 2M and under, and record-sizes 32K and under. The average improvement in this range was a rather respectable 5%, which is much higher than the overall average for the test of 1%. Performance seems to be affected more by file-size than by record-size, as the range of improvement over record-size was smaller than the range of improvement over the file-sizes. There is a hint in the data that 4K record-sizes for files larger than 16M are much better handled on NetWare, but that data was not gathered.
The Re-Write test showed similar patterns to the Write test, but slightly faster. As the description of the test says, a re-write doesn't affect meta-data to the same degree that a new file would. As with the Writer test, the best performance gain was in the range of file-sizes 2M and under, and record-sizes 32K and under. In that range the improvement was also 5%. Overall, the test showed a 2% improvement for running NCP on Linux. An interesting outlier in the data is the file-size of 8M, which turned in the worst result of the test at a -3%.
The Random Write test showed a 2% improvement in performance over NCP-on-NetWare. The best consistent performance was at the 64K and 256K file-sizes, each with a performance increase of 11%.
The Record Rewrite test showed the best performance of the write tests, at 3%. Every single record size tested showed at least a .5% improvement over NetWare. The best record-size was 4K, with a performance boost of 10%, and the worst was 16M, with performance just a hair over parity with NetWare. On the file-size front the results were very scattershot, with the best performance (21%) being turned in at the 128K file-size, and the worst (-5%) at the 4M file-size. The 'sweet spot' identified in the Writer test had an average improvement of 12%.
There were some trends over all of the writer tests as well. In every case, file-sizes of 16M and larger turned in a positive performance difference when run against NCP-on-Linux. The sweet-spot, file size of 2M or smaller and record size of 32K and smaller, turned in performance markedly better than the overall performance for that test.
Read Tests
The Reader test turned in an overall performance gain of 6% over NetWare. The tendency of the Writer report to show a decrease in performance at the 4K record size doesn't show up here. In fact, the number two and number three highest performance gain values on the chart were in the 4K record size column at the 2M (+38%) and 16M (+31%) file sizes. The 2M file-size showed the highest variability in performance as it had both the highest and lowest performance values on the chart. The 2M file-size with a 256K record size showed a -41% performance hit, and the 2M file-size with a 512K record size showed at +52% performance gain. The overall average for that file-size was 6%.
The Re-Reader test turned in a performance gain of 8%, which is presumably due to server-side caching of data being faster on Linux than on NetWare. There were two far outliers in the data which turned in performances 100% or better than the NetWare data. Looking at the raw data, these two results were due to NCP-on-NetWare turning in really bad numbers for 512K file-size and 8K record size, and 1M file-size and 64K record-size. Other than these two, the data is pretty even. As with the Reader test, the 4K record-size turned in very good numbers, especially at larger file-sizes.
The Random Read test turned in a performance gain of 6% over NCP-on-Netware. This was a hair faster than the initial Reader test, which shows that server-side caching still has a role to play. The range of values on this test was narrower than that reported by the Re-Reader test. There were no real 'hot spots' on the chart. The 4K record-size continued to show the largest variability.
The Backward Read test turned in the best value of the lot with a performance increase of 8% over NCP-on-NetWare. This test also had a far outlier at the 512K file-size/64K record-size level, where the NCP-on-NetWare test turned in an abysmal number. That value was excluded from the averaging, otherwise the performance increase of the test would have been a 9% and change. This test also showed a very strong value for the 4K record size, with an average performance increase of 21%. Another interesting result on this test is that the sweet spot identified in the Writer tests shows up on this one, with an average performance increase of 14%.
Unlike the Writer tests, the Reader tests didn't have any trouble at the 4K record-sizes on larger files. Overall performance was better than NetWare by a noticeable margin. There were a few exceptions, but generally speaking the results were consistent.
Conclusions
It is clear from the data that Novell has somehow managed to make NCP-on-Linux better than it was on NetWare. NetWare's historic claim as the end-all-be-all of File Servers may finally be coming to an end. Now to compare NCP-on-Linux (uncached) vs CIFS-on-Linux (uncached).
Part 8: NCP vs CIFS on Linux
Labels: benchmarking, netware, novell, OES
Wednesday, January 25, 2006
Benchmark results part 6: Conclusions so far
The analysis is done, and now it is time to make some decisions about what works best for us. As I've stated before, the majority of file-access to the NetWare cluster is with smaller files, and by definition smaller file-ranges. A lot of data on there is in larger files, but the count of those files is pretty small. On the User and Shared volumes, at least 50% of files are 64K or smaller; the smallest file-size in these tests.
I analyzed two big groups, NCP vs CIFS/SMB, and cached vs uncached. The cache/uncache was a surprise of the local settings, and it does taint the data. I hope to do another run with NCP-on-Linux in an uncached mode in order to better compare it against NCP-on-NetWare which seemed to run in an uncached state.
The NCP vs CIFS benchmarks were pretty clear. NCP is engineered to be better at handling files and access patterns in the range our users are most likely to use. This is unsurprising considering that Novell designed NCP to be a file-serving protocol from the ground up, and CIFS/SMB was more general purpose in mind. As such, for big files or large sub-ranges CIFS is the better protocol. In both of the cached and uncached comparisons NCP came out the winner.
When it comes to caching mechanisms, NCP worked best for our environment with one big exception in the 'Re-Reader' test. Microsoft's cache did this caching, so performance in that case was vastly better than the uncached NCP performance.
In the end what have I learned? The fact that the Novell Client performed local caching for the NCP-on-Linux test blew my testing objectives out of the water. In order to make any real tests I need to be able to test NCP-on-Linux in an uncached state, and I'm working on that. According to the tests, NCP-on-Linux is the best combination of protocol and caching.
Look for Part 7, where I compare NCP-on-Linux (uncached) against NCP-on-NetWare, and CIFS-on-Linux.
Part 7: Uncached NCP
Labels: benchmarking, netware, novell, OES
Benchmark results part 5: Comparing Uncached, NCP-on-NetWare vs CIFS-on-Linux
In this section I'm going to compare the two access methods that didn't have any local caching, NCP-on-NetWare and CIFS-on-Linux. The margin of differences between the two shouldn't be as large as it was for the cached methods, simply due to the relative speed of the network involved being a major limiter for speeds.
Write: This test measures the performance of writing a new file. When a new file is written not only does the data need to be stored but also the overhead information for keeping track of where the data is located on the storage media. This overhead is called the “metadata”It consists of the directory information, the space allocation and any other data associated with a file that is not part of the data contained in the file. It is normal for the initial write performance to be lower than the performance of rewriting a file due to this overhead information.The graph for this test shows a strong correlation to record-size in performance. Clearly NCP-on-NetWare is much better at handling small sub-ranges of files than CIFS-on-Linux. Once the sub-range gets to a certain size between 128K and 512K (depends on file-size) then CIFS-on-Linux provides better performance. For most types of filaccesses our users use, NCP-on-NetWare would provide the better performance.
Re-write: This test measures the performance of writing a file that already exists. When a file is written that already exists the work required is less as the metadata already exists. It is normal for the rewrite performance to be higher than the performance of writing a new file.As this graph also shows, there is a strong correlation to record-size in performance. The point where CIFS provides better performance comes a bit earlier, but the general trend remains.
Read: This test measures the performance of reading an existing file.This graph doesn't show as strong a correlation to record size. The performance boost that NCon0n-Linux provides isn't nearly as strong as it was with the previous two writing tests. It seems to do best on files of 64K and in smaller record sizes.
Re-Read: This test measures the performance of reading a file that was recently read. It is normal for the performance to be higher as the operating system generally maintains a cache of the data for files that were recently read. This cache can be used to satisfy reads and improves the performance.This graph looks a lot like the "read" graph. As above, the performance boost isn't terribly great. File-Size/Record-Size combinations that give a performance difference in excess of 10% are rare.
Random Read: This test measures the performance of reading a file with accesses being made to random locations within the file. The performance of a system under this type of activity can be impacted by several factors such as: Size of operating systemÂ’s cache, number of disks, seek latencies, and others.This graph continues the trend of the previous 'read' graphs in that it isn't quite as impressive. Record sizes of 128K and smaller yield small gains, and above that line CIFS-on-Linux is the better get. With a few visible exceptions, most performance is also within 10%.
Random Write: This test measures the performance of writing a file with accesses being made to random locations within the file. Again the performance of a system under this type of activity can be impacted by several factors such as: Size of operating systemÂ’s cache, number of disks, seek latencies, and others.This graph shows very similar trends with the previous Write graph. As with that graph, the break between NCP-on-NetWare being faster and CIFS-on-Linux being faster is when the record-size gets in the 128K-512K range. In terms of raw numbers, the Random Write is slower than the Write test, but this is to be expected.
Backwards Read: This test measures the performance of reading a file backwards. This may seem like a strange way to read a file but in fact there are applications that do this. MSC Nastran is an example of an application that reads its files backwards. With MSC Nastran, these files are very large (Gbytes to Tbytes in size). Although many operating systems have special features that enable them to read a file forward more rapidly, there are very few operating systems that detect and enhance the performance of reading a file backwards.This graph looks like the previous 'read' graphs.
Record Rewrite: This test measures the performance of writing and re-writing a particular spot within a file. This hot spot can have very interesting behaviors. If the size of the spot is small enough to fit in the CPU data cache then the performance is very high. If the size of the spot is bigger than the CPU data cache but still fits in the TLB then one gets a different level of performance. If the size of the spot is larger than the CPU data cache and larger than the TLB but still fits in the operating system cache then one gets another level of performance, and if the size of the spot is bigger than the operating system cache then one gets yet another level of performance.This graph looks nearly identical to the 'random write' test before.
While the results aren't as dramatic as they were for the cached methods, they are at least consistant. NCP-on-NetWare provides consistant and real performance improvements over a hardware-identical CIFS-on-Linux (Samba) configuration. Writing performance was much better in the file and record sizes we generally see on our NetWare servers. Large file sizes and record sizes were better handled by CIFS-on-Linux, but such access is a minority on our network. If we had a lot of video editing types around, I'd be singing a different story.
Part 6: Conclusions so far
Labels: benchmarking, netware, novell, OES
Tuesday, January 24, 2006
Benchmark results part 4: Comparing Cache, NCP-on-Linux vs CIFS-on-NetWare
In this section I'm comparing the two cached methods, NCP-on-Linux, and CIFS-on-NetWare. I'll do the uncached ones in the next section.
The comparison here is not as much apples-to-apples as I'd like. Microsoft caching, and Novell's caching use different mechanisms, and we're also going over different protocols and platforms as well. Because of this, the trends aren't nearly as clear cut as they were in the previous sections where we compared the differences between platforms.
Write: This test measures the performance of writing a new file. When a new file is written not only does the data need to be stored but also the overhead information for keeping track of where the data is located on the storage media. This overhead is called the 'metadata' It consists of the directory information, the space allocation and any other data associated with a file that is not part of the data contained in the file. It is normal for the initial write performance to be lower than the performance of rewriting a file due to this overhead information.For this test, NCP-on-Linux outperforms CIFS-on-NetWare in the areas of most interest. As with a few tests so far, the 'sweet spot' seems to be with a file-size under 32MB and a record size under 512KB. NCP-on-Linux particularly out-performs CIFS-on-NetWare in the small file ranges. Improvements of 200-400% are pretty common within the sweet-spot range, with a few combinations (such as 512KB file, 64KB record size) going as high as 1300%.
Re-write: This test measures the performance of writing a file that already exists. When a file is written that already exists the work required is less as the metadata already exists. It is normal for the rewrite performance to be higher than the performance of writing a new file.For this test, CIFS-on-NetWare outperforms NCP-on-Linux. However, the magnitude isn't nearly to the scale of the Write test. Record size again has something to do with the performance. The two methods reach near parity near a record size of 1MB. Though for files over 32MB, CIFS-on-NetWare provideconsistentnt 5-10% performance increase over NCP-on-Linux across the board.
Read: This test measures the performance of reading an existing file.For this test there is no clear winner. NCP-on-Linux generally outperforms CIFS-on-NetWare when the record-size is filesize, or filesize/2. It also has small increases, 5-10%, for 16KB record-sizes and files around 8MB. Generally speaking, though, CIFS-on-NetWare outperforms NCP-on-Linux by an average of 7% across the board.
Re-Read: This test measures the performance of reading a file that was recently read. It is normal for the performance to be higher as the operating system generally maintains a cache of the data for files that were recently read. This cache can be used to satisfy reads and improves the performance.This is very clear-cut. CIFS-on-NetWare blows the pants off of NCP-on-Linux for this test. The average performance increase for everything right up to playing with 512MB file is about 9000%. Why is this? Because NCP-on-Linux does NOT cache this particular test, and CIFS-on-NetWare does. This is a design choice from Novell, presumably.
Random Read: This test measures the performance of reading a file with accesses being made to random locations within the file. The performance of a system under this type of activity can be impacted by several factors such as: Size of operating system'’s cache, number of disks, seek latencies, and others.
For this test NCP-on-Linux is the winner. Especially for small record sizes or small files. For 4K records, the performance increase is 33% and for files 512K and under performance increase averages about 10% over CIFS-on-NetWare. Overall, performance is better by 10-15%.
Random Write: This test measures the performance of writing a file with accesses being made to random locations within the file. Again the performance of a system under this type of activity can be impacted by several factors such as: Size of operating system'’s cache, number of disks, seek latencies, and others.NCP-on-Linux is the winner in the ranges important to me. CIFS-on-NetWare has better performance for large files at large record-sizes. NCP-on-Linux is clearly better with record sizes 16K and under. 72% better at 4K record size, 55% better at 8K, 37% better at 16K, and 11% better at 32K.
Backwards Read: This test measures the performance of reading a file backwards. This may seem like a strange way to read a file but in fact there are applications that do this. MSC Nastran is an example of an application that reads its files backwards. With MSC Nastran, these files are very large (Gbytes to Tbytes in size). Although many operating systems have special features that enable them toThis is another test where NCP-on-Linux beats out CIFS-on-NetWare. The margin is not great, but consitent. As with the previous test, the best performance is with a 4KB record size. You have to get to the 16MB record-size to get a category that CIFS-on-NetWare outperforms NCP-on-Linux, and even there the difference is 3%. The overall performance increase of NCP-on-Linux is a shade under 9%.
read a file forward more rapidly, there are very few operating systems that detect and enhance the performance of reading a file backwards.
Record Rewrite: This test measures the performance of writing and re-writing a particular spot within a file. This hot spot can have very interesting behaviors. If the size of the spot is small enough to fit in the CPU data cache then the performance is very high. If the size of the spot is bigger than the CPU data cache but still fits in the TLB then one gets a different level of performance. If the size of the spot is larger than the CPU data cache and larger than the TLB but still fits in the operating system cache then one gets another level of performance, and if the size of the spot is bigger than the operating system cache then one gets yet another level of performance.This test showed a mixed result. For file-sizes 8MB and under, NCP-on-Linux clearly has a lead across all record-sizes. Results get a lot more spotty when file sizes go over that line. Performance is near parity when record-sizes are at 512KB and larger. CIFS-on-NetWare does best in the record-size 512KB and larger, and also in file-sizes 32MB and up. For the most common of file-access types, NCP-on-Linux would provide the best performance.
Overall, NCP-on-Linux appears to beat out CIFS-on-NetWare. The big exception is the ReRead test, where NCP-on-Linux doesn't even attempt to cache and the results are raw-IO. On a client station with small amounts of RAM, these results may be different since the caching being tested here is a function of the local machine rather than the servers. The servers do play a role, however, so this does need to be included.
Part 5: Comparing Uncached, NCP-on-NetWare vs CIFS-on-Linux
Labels: benchmarking, netware, novell, OES
![]()

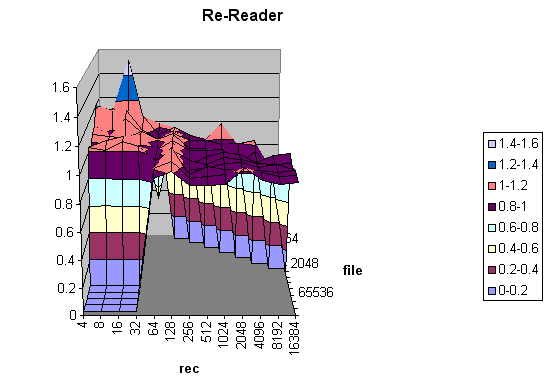
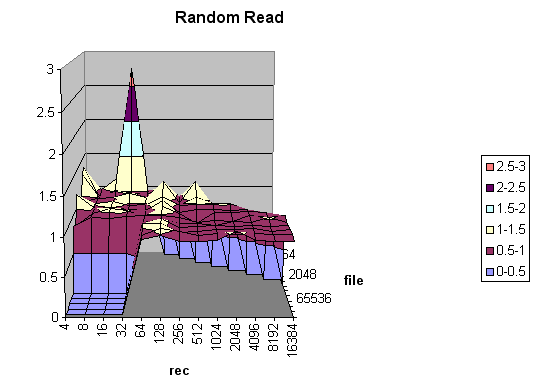
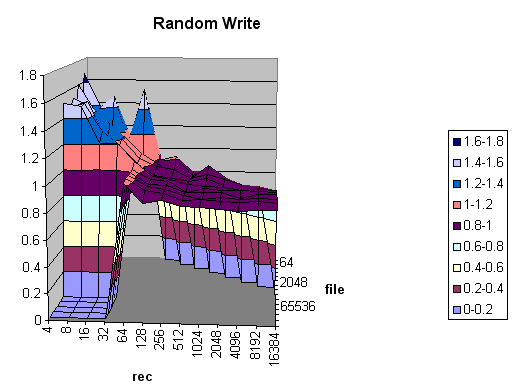