Monday, September 18, 2006
Results: create operation differences
Looking at charts that show just create operations on the platforms are interesting.
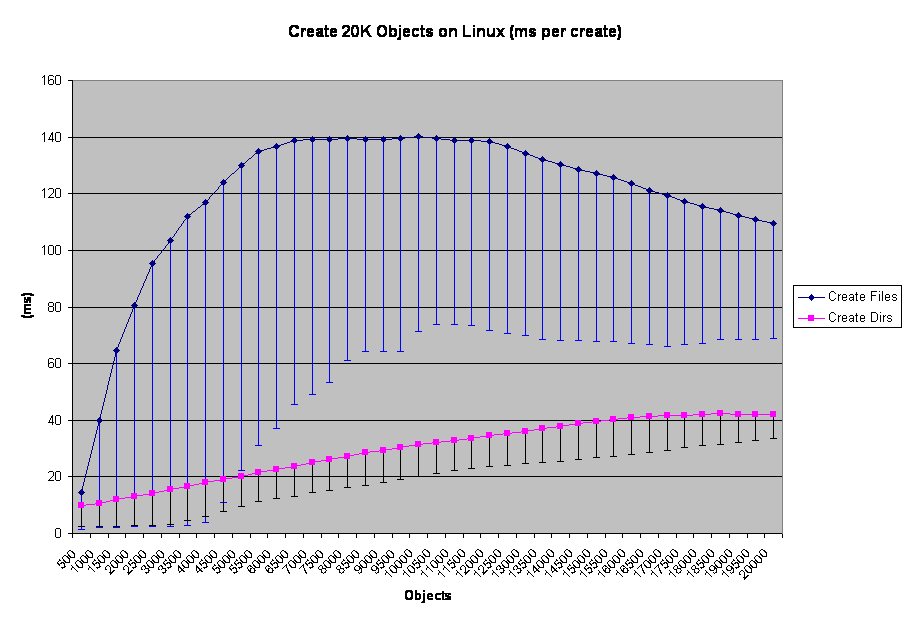
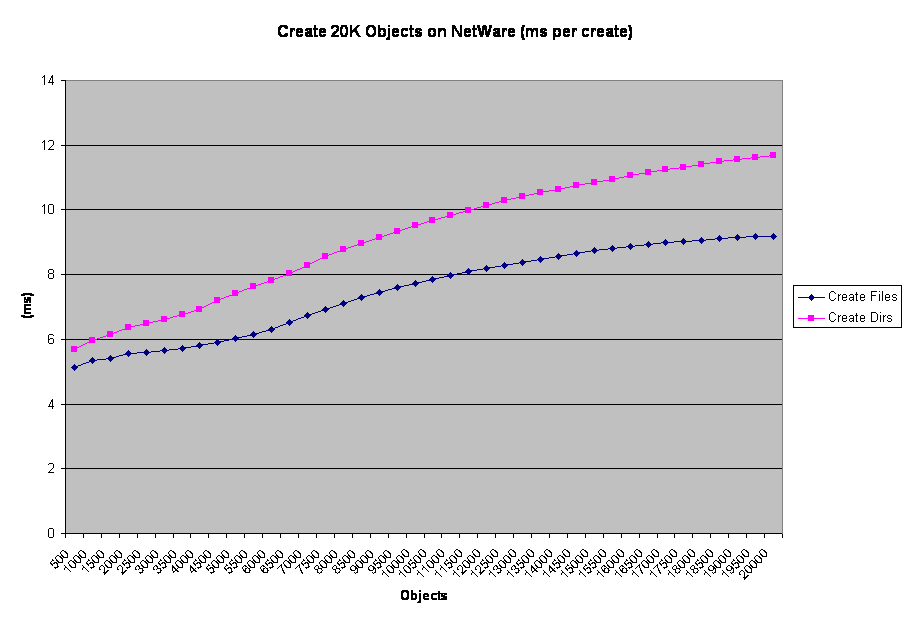
 I just put the Min values in the error bars to make it a cleaner graph. But here you can see the trend mentioned in the file-create tess about the 4000 object line. Only here 4500 objects seems to be the point where file-create passes dir-create in terms of time per operation. This is a result of CPU usage and the fact that file-create appears to be more affected by it than NetWare is. The idential NetWare chart is illustrative, but since CPU never went above 70% for more than a few moments it isn't a pure apples-to-apples comparison.
 In this case, file-create remains below dir-create for the whole run. What's more, dir-create drove CPU a lot harder than file-create did. The early data in the Linux run shows that OES-Linux would follow this file-create-is-faster pattern given sufficient CPU.
Exactly why file-create performance degrades so fast when CPU contention begins is unclear me. In terms of disk bandwidth, all four tests barely twitched the needle on the SAN monitor; these tests do not involve big I/O transfers. As far as NSS is concerned, a directory and a file are very similar objects in the grand scheme of things. Yet NSS seems to track more data related to directories than files, so it seems counter intuitive that file-create would lag when CPU becomes a problem. This question is one I should bring with me to BrainShare 2007.
Next, IOZONE and throughput tests.
Tags: novell, benchmarking
 I just put the Min values in the error bars to make it a cleaner graph. But here you can see the trend mentioned in the file-create tess about the 4000 object line. Only here 4500 objects seems to be the point where file-create passes dir-create in terms of time per operation. This is a result of CPU usage and the fact that file-create appears to be more affected by it than NetWare is. The idential NetWare chart is illustrative, but since CPU never went above 70% for more than a few moments it isn't a pure apples-to-apples comparison.
 In this case, file-create remains below dir-create for the whole run. What's more, dir-create drove CPU a lot harder than file-create did. The early data in the Linux run shows that OES-Linux would follow this file-create-is-faster pattern given sufficient CPU.
Exactly why file-create performance degrades so fast when CPU contention begins is unclear me. In terms of disk bandwidth, all four tests barely twitched the needle on the SAN monitor; these tests do not involve big I/O transfers. As far as NSS is concerned, a directory and a file are very similar objects in the grand scheme of things. Yet NSS seems to track more data related to directories than files, so it seems counter intuitive that file-create would lag when CPU becomes a problem. This question is one I should bring with me to BrainShare 2007.
Next, IOZONE and throughput tests.
Tags: novell, benchmarking
Labels: benchmarking, novell
