Tuesday, January 12, 2010
The costs of backup upgrades
Our tape library is showing its years, and it's time to start moving the mountain required to get it replaced with something. So this afternoon I spent some quality time with google, a spread-sheet, and some oldish quotes from HP. The question I was trying to answer is what's the optimal mix of backup to tape and backup to disk using HP Data Protector. The results were astounding.
Data Protector licenses backup-to-disk capacity by the amount of space consumed in the B2D directories. You have 15TB parked in your backup-to-disk archives, you pay for 15TB of space.
Data Protector has a few licenses for tape libraries. They have costs for each tape drive over 2, another license for libraries with between 61-250 slots, and another license for unlimited slots. There is no license for fibre-attached libraries like BackupExec and others do.
Data Protector does not license per backed up host, which is theoretically a cost savings.
When all is said and done, DP costs about $1.50 per GB in your backup to disk directories. In our case the price is a bit different since we've sunk some of those costs already, but they're pretty close to a buck fiddy per GB for Data Protector licensing alone. I haven't even gotten to physical storage costs yet, this is just licensing.
Going with an HP tape library (easy for me to spec, which is why I put it into the estimates), we can get an LTO4-based tape library that should meet our storage growth needs for the next 5 years. After adding in the needed DP licenses, the total cost per GB (uncompressed, mind) is on the order of $0.10 per GB. Holy buckets!
Calming down some, taking our current backup volume and apportioning the price of largest tape library I estimated over that backup volume and the price rises to $1.01/GB. Which means that as we grow our storage, the price-per-GB drops as less of the infrastructure is being apportioned to each GB. That's a rather shocking difference in price.
Clearly, HP really really wants you to use their de-duplication features for backup-to-disk. Unfortunately for HP, their de-duplication technology has some serious deficiencies when presented with our environment so we can't use it for our largest backup targets.
But to answer the question I started out with, what kind of mix should we have, the answer is pretty clear. As little backup-to-disk space as we can get away with. The stuff has some real benefits, as it allows us to stage backups to disk and then copy to tape during the day. But for long term storage, tape is by far the more cost-effective storage medium. By far.
Monday, September 28, 2009
Browser usage on tech-blogs
Ars Technica just posted their August browser update. They also included their own browser breakdown. ArsTechnica is a techie site, so it comes as no surprise what so ever that Firefox dominates at 45% of browser-share. This made me think about my own readership.

As you can see, Firefox makes up even more of the browser-share here (50.34%). Interestingly on the low end, Opera is actually the #3 browser (4.46%), not Safari (3.43%). Looking at the version breakdown for those IE users, only 17% of them are on IE6. Yay!
ArsTechnica's Safari numbers are not at all surprising, since they cover a fair amount of Apple news and I don't.
So yeah, Tech blogs and sites don't have a lot of IE traffic. Or, so I believe. What are your numbers?
Labels: stats
Monday, September 21, 2009
Printing habits
Some students are going to be in for a rude, rude surprise real soon. Today alone there is a student who has printed off 210 pages. Looking at their print history, they printed off 100 copies of two specific handouts (in batches of 50), and that's 40% of their entire quota for the quarter. Once they hit the ceiling, they'll have to pay to get more. This is different from last year!
We always got a few students who rammed their head against the 500 page limit within two weeks of quarter start. I'm sure we'll get some this quarter too. There may be heated tempers at the Helpdesk as a result, but thems the breaks.
We always got a few students who rammed their head against the 500 page limit within two weeks of quarter start. I'm sure we'll get some this quarter too. There may be heated tempers at the Helpdesk as a result, but thems the breaks.
Thursday, June 18, 2009
Historical data-center
As I've mentioned several times here, our data-center was designed and built in the 1999-2000 time frame. Before then, Technical Services had offices in Bond Hall up on campus. The University decided to move certain departments that had zero to very little direct student contact off of campus as a space-saving measure. Technical Service was one of those departments. As were Administrative Computing Services, Human Resources, Telecom, and Purchasing.
At that time, all of our stuff was in the Bond Hall data-center and switching room. This predates me (December 2003), so I may be wrong on some of this stuff. That's a tiny area, and the opportunity to design a brand new data-center from scratch was a delightful one for those who were here to partake of it.
At the time, our standard server was, if I've got the history right, the HP LH3. Like this:

This beast is 7U's high. We were in the process of replacing them with HP ML530's, another 7U server, when the data-center move came, but I'm getting a bit ahead of myself. This means that the data-center was planned with 7U servers in mind. Not the 1-4U rack-dense servers that were very common at that time.
Because the 2U flat-panel monitor and keyboard drawers for rack-dense racks were so expensive, we decided to use plain old 15-17" CRTs and keyboard drawers in the racks themselves. These take up 14U. But that's not a problem!
A 42U rack can take 4x of those 7U servers, and one of the 14U monitor/keyboard combinations for a total of...42U! A perfect fit! The Sun side of the house had their own servers, but I don't know anything about those. With four servers per rack, we put in a Belkin 4-port PS-2 KVM switch (USB was still too new fangled in this era, our servers didn't really have USB ports in them yet) in each. As I said, a perfect fit.
And since we could plan our very own room, we planned for expansion! A big room. With lots of power overhead. And a generator. And a hot/cold aisle setup.
Unfortunately... the designers of the room decided to use a bottom-to-top venting strategy for the heat. With roof mounted rack fans.

And... solid back doors.

We got away with this because only HAD four servers per rack, and those servers were dual processor 1GHz servers. So we only had 8 cores running in the entire rack. This thermal environment worked just fine. I think each rack probably drew no more than 2KW, if that much.
If you know anything about data-center air-flow, you know where our problems showed up when we moved to rack-dense servers in 2004-8 (and a blade rack). We've managed to get some fully vented doors in there to help encourage a more front-to-back airflow. We've also put some air-dams on top of the racks to discourage over-the-top recirculation.
And picked up blanking panels. When we had 4 monster servers per rack we didn't need blanking panels. Now that we're mostly on 1U servers, we really need blanking panels. Plus a cunning use of plexi-glass to provide a clear blanking panel for the CRTs still in the racks.
And now, we have a major, major budget crunch. We had to fight to get the fully perforated doors, and that was back when we had money. Now we don't have money, and still need to improve things. We're not baking servers right now, but temperatures are such that we can't raise the temp in the data-center very much to save on cooling costs. Doing that will require spending some money, and that's very hard right now.
Happily, rack-dense servers and ESX have allowed us to consolidate down to a lot fewer racks, where we can concentrate our good cooling design. Those are hot racks, but at least they aren't baking themselves like they would with the original kit.
At that time, all of our stuff was in the Bond Hall data-center and switching room. This predates me (December 2003), so I may be wrong on some of this stuff. That's a tiny area, and the opportunity to design a brand new data-center from scratch was a delightful one for those who were here to partake of it.
At the time, our standard server was, if I've got the history right, the HP LH3. Like this:
This beast is 7U's high. We were in the process of replacing them with HP ML530's, another 7U server, when the data-center move came, but I'm getting a bit ahead of myself. This means that the data-center was planned with 7U servers in mind. Not the 1-4U rack-dense servers that were very common at that time.
Because the 2U flat-panel monitor and keyboard drawers for rack-dense racks were so expensive, we decided to use plain old 15-17" CRTs and keyboard drawers in the racks themselves. These take up 14U. But that's not a problem!
A 42U rack can take 4x of those 7U servers, and one of the 14U monitor/keyboard combinations for a total of...42U! A perfect fit! The Sun side of the house had their own servers, but I don't know anything about those. With four servers per rack, we put in a Belkin 4-port PS-2 KVM switch (USB was still too new fangled in this era, our servers didn't really have USB ports in them yet) in each. As I said, a perfect fit.
And since we could plan our very own room, we planned for expansion! A big room. With lots of power overhead. And a generator. And a hot/cold aisle setup.
Unfortunately... the designers of the room decided to use a bottom-to-top venting strategy for the heat. With roof mounted rack fans.
And... solid back doors.
We got away with this because only HAD four servers per rack, and those servers were dual processor 1GHz servers. So we only had 8 cores running in the entire rack. This thermal environment worked just fine. I think each rack probably drew no more than 2KW, if that much.
If you know anything about data-center air-flow, you know where our problems showed up when we moved to rack-dense servers in 2004-8 (and a blade rack). We've managed to get some fully vented doors in there to help encourage a more front-to-back airflow. We've also put some air-dams on top of the racks to discourage over-the-top recirculation.
And picked up blanking panels. When we had 4 monster servers per rack we didn't need blanking panels. Now that we're mostly on 1U servers, we really need blanking panels. Plus a cunning use of plexi-glass to provide a clear blanking panel for the CRTs still in the racks.
And now, we have a major, major budget crunch. We had to fight to get the fully perforated doors, and that was back when we had money. Now we don't have money, and still need to improve things. We're not baking servers right now, but temperatures are such that we can't raise the temp in the data-center very much to save on cooling costs. Doing that will require spending some money, and that's very hard right now.
Happily, rack-dense servers and ESX have allowed us to consolidate down to a lot fewer racks, where we can concentrate our good cooling design. Those are hot racks, but at least they aren't baking themselves like they would with the original kit.
Wednesday, June 17, 2009
We go through paper
Spring quarter is done, and grades are turned in. Time to take a look at student printing counts.
Things are changing! Printing costs do keep rising, and for a good discussion of realities check this article from ATUS News. The numbers in there are from Fall quarter. Now I'll give some Spring quarter numbers (departmental break down is different than the article, since I'm personally not sure which labs belong to which department):
Numbers are from 3/29/09-6/17/09 (8:17am)
Total Pages Printed: 1,840,186
ATUS Labs: 51.5%
Library Printers: 22.9%
Housing Labs: 14%
Comms Bldg: 6.8%
Average pages printed per user: 152
Median pages printed per user: 112
Number of users who printed anything: 12,119
Number of users over 500 pages: 292
Number of users over 1000 pages: 7
"Over quota" pages printed: 181,756
Students get a free quota of 500 pages each quarter. Getting more when you run out is as simple as contacting a helpdesk and getting your quota upped. As you can see, 2.4% of users managed to account for 9.9% of all pages printed.
It is a common misconception that the Student Tech Fee pays for the 500 pages each student gets. In actuality, that cost is eaten by each of the departments running a student printer, which means that printing has historically been a gratis benefit. There is a proposal going forward that would change things so you'd have to pay $.05/page for upping your quota. The top print-user of this quarter would have had to have paid a bit over $69 in additional quota if we were using the pay system. If ALL of the users who went over 500 pages had to pay for their additional quota, that would have generated a bit under $9088 in recovered printing costs.
Of course, if added print quota were a cost-item it will depress that overage activity. Another curve-ball is the desire of certain departments to offer color printing, but they really want to recapture their printing costs for those printers. So far we haven't done a good job of that, but we are in the process of revising the printing system to better handle it. It'll require some identity-management code changes to handle the quota management process differently, but it is at least doable.
Once you start involving actual money in this transaction, it opens up a whole 'nother can o worms. First off, cash-handling. Our help-desks do not want to be in the business of dealing with cash, so we'll need some kind of swipe-kiosh to handle that. Also, after-hours quota-bumps will need to be handled since our helpdesks are not 24/7 and sometimes students run out of quota at 6am during finals week and have an 8am class.
Second, accounting. Not all labs are run by ATUS. Some labs are run by departments that charge lab-fees that ostensibly also support lab printing. Some way to apportion recovered printing costs to departments will have to be created. Those departments that charge lab-fees may find it convenient to apply a portion of those fees to their student's page-quota.
Third, extra-cost printing like color. PCounter allows printers to be configured to not allow the use of 'free quota' for printing. So in theory, things like color or large-format-printers could be configured to only accept paid-for quota. These devices will have a cost higher than $.05/page, perhaps even $.25/page for color, or much higher for the LFP's. It could also mean some departmental lab-managers may decide to stop accepting free-quota in their labs and go charge-only.
Fourth, carry-over of paid quota. If a student forks over $20 for added quota, that should carry over until it is used. Also, it is very likely that they'll demand a refund of any unspent print-quota on graduation. Some refund mechanism will also need to be created.
I don't know at what step the proposal is, all I know is that it hasn't been approved yet. But it is very likely to be approved for fall.
Monday, April 13, 2009
MyWeb statistics
An interesting inversion has happened recently. The Fac/Staff myweb has overtaken the Student myweb in terms of data moved. Most of the student-side top-transfer stuff are mp3 files and other media files, where on the fac/staff side the top transfers seem to be big zip-files for classwork.
It would not surprise me to learn that some faculty have figured out that you can get around Copy Services by putting together PDFs of the articles they want to pass out to students. I already know that many faculty use MyWeb for distributing things to their students, not everyone loves BlackBoard.
It would not surprise me to learn that some faculty have figured out that you can get around Copy Services by putting together PDFs of the articles they want to pass out to students. I already know that many faculty use MyWeb for distributing things to their students, not everyone loves BlackBoard.
Labels: stats
Monday, March 23, 2009
Paper paper paper
It is spring break, so I can now run nice statistics on our pcounter printers! Not all of our labs are on pcounter, so these numbers are not the total printing at WWU. However, if plans to recover printing costs by charging for quota increases go through, I expect I should have the entire campus on pcounter within 3 quarters of go-live. Students WILL find the 'free' labs. And the lab admins will notice that their printing costs go way up. And then they'll call me.
Winter quarter
Pages printed: 1,781,272
Total number of students who printed at least one page: 12,482
Average pages printed by a student: 142.6
Median pages printed: 106
The busiest printer printed 133,791 pages
Res-halls printed 255,344 pages
That's a lot of paper.
Winter quarter
Pages printed: 1,781,272
Total number of students who printed at least one page: 12,482
Average pages printed by a student: 142.6
Median pages printed: 106
The busiest printer printed 133,791 pages
Res-halls printed 255,344 pages
That's a lot of paper.
Wednesday, January 28, 2009
Spam stats
It has been a while. Some current spam stats from our border appliance:
That is a lot of spam. The 'Zombie' class are connections rejected due to IP reputation. Between zombies and outright spam detections, 95% of all incoming mail has been rejected over the last 30 days. Shortly after the McColo shutdown that percentage dropped a lot. We're now back to where we were before the shutdown.
| | Processed | Spam | Suspected Spam | Attacks | Zombie | Blocked | Allowed | Viruses | Suspected Virus | Worms | Unscannable | Malware | Passworded .zip file | Content |
| Last 30 days | 9,489,662 | 4,328,334 (46%) | 8,895 (<> | 221,926 (2%) | 4,163,253 (44%) | 1 (<> | 10,248 (<> | 1,265 (<> | 1,233 (<> | 2,590 (<> | 26,508 (<> | 0 (0%) | 13 (<> | 0 (0%) |
That is a lot of spam. The 'Zombie' class are connections rejected due to IP reputation. Between zombies and outright spam detections, 95% of all incoming mail has been rejected over the last 30 days. Shortly after the McColo shutdown that percentage dropped a lot. We're now back to where we were before the shutdown.
Wednesday, January 21, 2009
Website stats
We purchased Urchin's web stats package before Google bought them. We're still using that creaky old software, even though its ability to interpret user agent string is diminishing. I'm not in the webmaster crew for this university, I'm just a client. But I do track the MyWeb stats through Urchin.
I also track our MyFiles (NetStorage) stats. This became more interesting the other day when I noticed that just over 40% of the bandwidth used by the Fac/Staff NetStorage server was transferred to user agents that are obviously WebDav. This is of note because WebDav clients are not javascript enabled, and thus will not register to things like Google Analytics. If I had been relying on Google Analytics for stats for NetStorage, I'd have missed the largest single agent-string.
Even though Google bought Urchin, it makes sense that they dropped the logfile-parsing technology in favor of a javascript enabled one. Google is an advertising firm with added services to attract people to their advertising, and it's hard to embed advertising in a WebDav connection. It used to be the case that RSS feeds were similar, but that's now a solved problem (as anyone who has looked at slashdot's feed knows).
In my specific case I want to know what the top pages are, which files are getting a lot of attention, as well as the usual gamut of browser/OS statistics (student myweb has a higher percentage of Mac hits, for one). One of the things I regularly look for are .MP3 files on the Student MyWeb service getting a lot of attention. For a while there the prime user-agents hitting those files were flash-based media player/browsers embedded on web pages, just the sort of thing that only logfile-parsing would catch.
One thing that the NetStorage logs give me is a good idea as to how popular the service is. Since apache logs will show the username if the user is authenticated, I can count how many unique user ID's used the service over a specific period. That can tell me how strong uptake is. I may be wrong, but I believe Google Analytics wouldn't do that.
The Urchin we have is still providing the data I need, but it's still getting stale. It's OS detection is falling apart in this era of Vista and 64-bit anything. But, it's still way better than Analytics for what I need.
Friday, November 21, 2008
Browser stats
Some stats of who reads this blog (roughly):
And operating system:
Firefox out numbers IE, which is no surprise considering the type of search-traffic I get. I'm a bit surprised at how little Safari I see. Also interesting is that Linux edges out Mac on the OS chart, again not that surprising considering what I talk about here.
| FF3 | 45% | |
| IE | 42% | |
| FF2 | 4% | |
| Other | 9% |
And operating system:
| XP | 63.20% | |
| Vista | 14.98% | |
| Linux | 12.86% | |
| OS-X | 5.40% | |
| Other | 2.33% | |
| Win2003 | 1.23% |
Firefox out numbers IE, which is no surprise considering the type of search-traffic I get. I'm a bit surprised at how little Safari I see. Also interesting is that Linux edges out Mac on the OS chart, again not that surprising considering what I talk about here.
Labels: stats
Tuesday, November 18, 2008
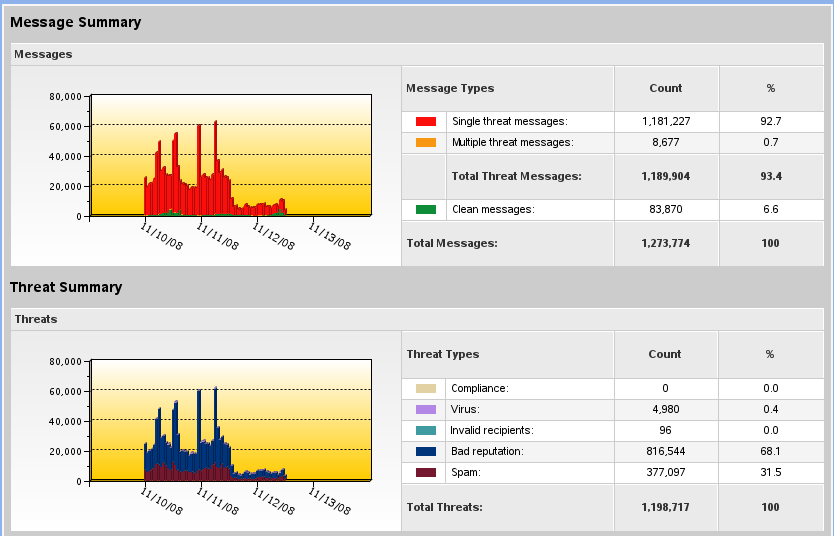
Spam drop-off continues
It's been a week, and they haven't replaced their lost spam capacity yet.
The green bars are the 'clean' messages. But look at that! Over half of our incoming spam was from the same botnet/hosting provider. Wow. But, I do expect levels to go back to normal before too long.
The green bars are the 'clean' messages. But look at that! Over half of our incoming spam was from the same botnet/hosting provider. Wow. But, I do expect levels to go back to normal before too long.
Wednesday, November 12, 2008
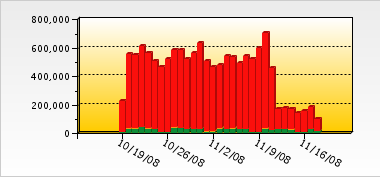
Very visible drop off in spam
Thanks to this, we've seen a significant drop-off in spam. And what better way to show it than with a graph?
Dramatic, eh?
Let's see long it takes 'em to find a new host and re-tool. This is but a brief respite, but it's fun to look at.
Dramatic, eh?
Let's see long it takes 'em to find a new host and re-tool. This is but a brief respite, but it's fun to look at.
Friday, October 31, 2008
Printer stats
It has been a while since I last talked about printer statistics. Being a higher ed place of learning, we have student labs. These labs have printers. And like pretty much every place of learning I've ever spoken to, we do whatever we can to restrict printing to reasonable levels. In our case, we do this with PCounter.
For October, the sum total of pages printed (as of this morning, so it isn't ALL of October) from student printers we audit, was...
585,000 pages
That's a lot of paper.
Our busiest hour was 11:00-11:59, where 70,000 (12%) of those pages were printed.
Our second busiest hour was 13:00-13:59, where 63,000 (10%) of those pages were printed.
Our lightest hour was 4:00-4:59, where 360 of those pages were printed (the large majority from the HH154 printers).
The busiest single printer was one of the Library printers, with 48,000 pages.
The busiest lab (multiple printers) was the HH154 lab, with a combined total of 71,000 pages.
The busiest dorm printer was in the Fairhaven complex, with a total of 32,000 pages.
Of the around 22,000 active students we have, 10,509 (47.8%) of them printed at least one page from one of the audited printers.
The above comes to about 43 pages per full-time-equivalent student, or around 26 pages per active student for the month of October. The busiest user printed 892 pages in October, though only three users were over the 500 standard page-quota. Paper and toner are a significant cost of doing business.
Friday, September 19, 2008
Monitoring ESX datacenter volume stats
A long while back I mentioned I had a perl script that we use to track certain disk space details on my NetWare and Windows servers. That goes into a database, and it can make for some pretty charts. A short while back I got asked if I could do something like that for the ESX datacenter volumes.
A lot of googling later I found how to turn on the SNMP daemon for an ESX host, and a script or two to publish the data I need by SNMP. It took some doing, but it ended up pretty easy to do. One new perl script, the right config for snmpd on the ESX host, setting the ESX host's security policy to permit SNMP traffic, and pointing my gathering script at the host.
The perl script that gathers the local information is very basic:
Then append the /etc/snmp/snmp.conf file with the following lines (in my case):
The first parameter after exec is the OID to publish. The script returns an array of values, one element per line, that are assigned to .0, .1, .2 and on up. I'm publishing the details I'm interested in, which may be different than yours. That's the 'print' line in the script.
The script itself lives in /root/bin/ since I didn't know where better to put it. It has to have execute rights for Other, though.
The big unique-ID looking number is just that, a UUID. It is the UUID assigned to the VMFS volume. The VMFS volumes are multi-mounted between each ESX host in that particular cluster, so you don't have to worry about chasing the node that has it mounted. You can find the number you want by logging in to the ESX host on the SSH console, and doing a long directory on the /vmfs/volumes folder. The friendly name of your VMFS volume is symlinked to the UUID. The UUID is what goes in to the snmp.conf file.
The last parameter ("Disk1" and "Disk2" above) is the friendly name of the volume to publish over SNMP. As you can see, I'm very creative.
These values are queried by my script and dropped into the database. Since the ESX datacenter volumes only get space consumed when we provision a new VM or take a snapshot, the graph is pretty chunky rather than curvy like the graph I linked to earlier. If VMware ever changes how the vmfstools command returns data, this script will break. But until then, it should serve me well.
A lot of googling later I found how to turn on the SNMP daemon for an ESX host, and a script or two to publish the data I need by SNMP. It took some doing, but it ended up pretty easy to do. One new perl script, the right config for snmpd on the ESX host, setting the ESX host's security policy to permit SNMP traffic, and pointing my gathering script at the host.
The perl script that gathers the local information is very basic:
#!/usr/bin/perl -w

use strict;
my $partition = ".";
my $partmaps = ".";
my $vmfsvolume = "\Q/vmfs/volumes/$ARGV[0]\Q";
my $vmfsfriendly = $ARGV[1];
my $capRaw = 0;
my $capBlock = 0;
my $blocksize = 0;
my $freeRaw = 0;
my $freeBlock = 0;
my $freespace= "";
my $totalspace= "";
open("Y", "/usr/sbin/vmkfstools -P $vmfsvolume|");
while () {
        if (/Capacity ([0-9]*).*\(([0-9]*).* ([0-9]*)\), ([0-9]*).*\(([0-9]*).*a
vail/) {
                $capRaw = $1;
                $capBlock = $2;
                $blocksize = $3;
                $freeRaw = $4;
                $freeBlock = $5;
                $freespace = $freeBlock;
                $totalspace = $capBlock;
                $blocksize = $blocksize/1024;
                #print ("1 = $1\n2 = $2\n3 = $3\n4 = $4\n5 = $5\n");
                print ("$vmfsfriendly\n$totalspace\n$freespace\n$blocksize\n");
        }
}
Then append the /etc/snmp/snmp.conf file with the following lines (in my case):
exec .1.3.6.1.4.1.6876.99999.2.0 vmfsspace /root/bin/vmfsspace.specific 48cb2cbc
-61468d50-ed1f-001cc447a19d Disk1

exec .1.3.6.1.4.1.6876.99999.2.1 vmfsspace /root/bin/vmfsspace.specific 48cb2cbc
-7aa208e8-be6b-001cc447a19d Disk2
The first parameter after exec is the OID to publish. The script returns an array of values, one element per line, that are assigned to .0, .1, .2 and on up. I'm publishing the details I'm interested in, which may be different than yours. That's the 'print' line in the script.
The script itself lives in /root/bin/ since I didn't know where better to put it. It has to have execute rights for Other, though.
The big unique-ID looking number is just that, a UUID. It is the UUID assigned to the VMFS volume. The VMFS volumes are multi-mounted between each ESX host in that particular cluster, so you don't have to worry about chasing the node that has it mounted. You can find the number you want by logging in to the ESX host on the SSH console, and doing a long directory on the /vmfs/volumes folder. The friendly name of your VMFS volume is symlinked to the UUID. The UUID is what goes in to the snmp.conf file.
The last parameter ("Disk1" and "Disk2" above) is the friendly name of the volume to publish over SNMP. As you can see, I'm very creative.
These values are queried by my script and dropped into the database. Since the ESX datacenter volumes only get space consumed when we provision a new VM or take a snapshot, the graph is pretty chunky rather than curvy like the graph I linked to earlier. If VMware ever changes how the vmfstools command returns data, this script will break. But until then, it should serve me well.
Labels: stats, storage, sysadmin, virtualization
Friday, April 11, 2008
On email, what comes in it
A friend recently posted the following:
Looking at statistics on the mail filter in front of Exchange, it looks like 5.9% of incoming messages for the last 7 days are clean. That is a LOT of messages getting dropped on the floor. This comes to just shy of 40,000 legitimate mail messages a day. For comparison, the number of mail messages coming in from Titian (the student email system, and unpublished backup MTA) has a 'clean' rate of 42.5%, or 2800ish legit messages a day.
People expect their email to be legitimate. Directory-harvesting attacks do constitute the majority to discrete emails; these are the messages you receive that have weird subjects, come from people you don't know, but don't have anything in the body. They're looking to see which addresses result in 'no person by that name here' messages and those that seemingly deliver. This is also why people unfortunate enough to have usernames or emails like "fred@" or "cindy@" have the worst spam problems of any organization.
As I've mentioned many times, we're actively considering migrating student email to one of the free email services offered by Google or Microsoft. This is because historically student email has had a budget of "free", and our current strategy is not working. The way it is not working is because the email filters aren't robust enough to meet expectation. Couple that with the expectation of effectively unlimited mail quota (thank you Google) and student email is no longer a "free" service. We can either spend $30,000 or more on an effective commercial anti-spam product, or we can give our email to the free services in exchange for valuable demographic data.
It's very hard to argue with economics like that.
One thing that you haven't seen yet in this article are viruses. In the last 7 days, our border email filter saw that 0.108% of incoming messages contain viruses. This is a weensy bit misleading, since the filter will drop connections with bad reputations before even accepting mail and that may very well cut down the number of reported viruses. But the fact remains that viruses in email are not the threat they once were. All the action these days are on subverted and outright evil web-sites, and social engineering (a form of virus of the mind).
This is another example of how expectation and reality differ. After years of being told, and in many cases living through the after-effects of it, people know that viruses come in email. The fact that the threat is so much more based on social engineering hasn't penetrated as far, so products aimed at the consumer call themselves anti-virus when in fact most of the engineering in them was pointed at spam filtering.
Anti-virus for email is ubiquitous enough these days that it is clear that the malware authors out there don't bother with email vectors for self-propagating software any more. That's not where the money is. The threat had moved on from cleverly disguised .exe files to cunningly wrought (in their minds) emails enticing the gullible to hit a web site that will infest them through the browser. These are the emails that border filters try to keep out, and it is a fundamentally harder problem than .exe files were.
The big commercial vendors get the success rate they do for email cleaning in part because they deploy large networks of sensors all across the internet. Each device or software-install a customer turns on can potentially be a sensor. The sensors report back to the mother database, and proprietary and patented methods are used to distill out anti-spam recipes/definitions/modules for publishing to subscribed devices and software. There is nothing saying that an open-source product can't do this, but the mother-database is a big cost that someone has to pay for and is a very key part of this spam fighting strategy. Bayesian filtering only goes so far.
And yet, people expect email to just be clean. Especially at work. That is a heavy expectation to meet.
80-90% of ALL email is directory harvesting attacks. 60-70% of the rest is spam or phishing. 1-5% of email is legit. Really makes you think about the invisible hand of email security, doesn't it?Those of us on the front lines of email security (which isn't quite me, I'm more of a field commander than a front line researcher) suspected as much. And yes, most people, nay, the vast majority, don't realize exactly what the signal-to-noise ratio is for email. Or even suspect the magnitude. I suspect that the statistic of, "80% of email is crap," is well known, but I don't think people even realize that the number is closer to, "95% of email is crap."
Looking at statistics on the mail filter in front of Exchange, it looks like 5.9% of incoming messages for the last 7 days are clean. That is a LOT of messages getting dropped on the floor. This comes to just shy of 40,000 legitimate mail messages a day. For comparison, the number of mail messages coming in from Titian (the student email system, and unpublished backup MTA) has a 'clean' rate of 42.5%, or 2800ish legit messages a day.
People expect their email to be legitimate. Directory-harvesting attacks do constitute the majority to discrete emails; these are the messages you receive that have weird subjects, come from people you don't know, but don't have anything in the body. They're looking to see which addresses result in 'no person by that name here' messages and those that seemingly deliver. This is also why people unfortunate enough to have usernames or emails like "fred@" or "cindy@" have the worst spam problems of any organization.
As I've mentioned many times, we're actively considering migrating student email to one of the free email services offered by Google or Microsoft. This is because historically student email has had a budget of "free", and our current strategy is not working. The way it is not working is because the email filters aren't robust enough to meet expectation. Couple that with the expectation of effectively unlimited mail quota (thank you Google) and student email is no longer a "free" service. We can either spend $30,000 or more on an effective commercial anti-spam product, or we can give our email to the free services in exchange for valuable demographic data.
It's very hard to argue with economics like that.
One thing that you haven't seen yet in this article are viruses. In the last 7 days, our border email filter saw that 0.108% of incoming messages contain viruses. This is a weensy bit misleading, since the filter will drop connections with bad reputations before even accepting mail and that may very well cut down the number of reported viruses. But the fact remains that viruses in email are not the threat they once were. All the action these days are on subverted and outright evil web-sites, and social engineering (a form of virus of the mind).
This is another example of how expectation and reality differ. After years of being told, and in many cases living through the after-effects of it, people know that viruses come in email. The fact that the threat is so much more based on social engineering hasn't penetrated as far, so products aimed at the consumer call themselves anti-virus when in fact most of the engineering in them was pointed at spam filtering.
Anti-virus for email is ubiquitous enough these days that it is clear that the malware authors out there don't bother with email vectors for self-propagating software any more. That's not where the money is. The threat had moved on from cleverly disguised .exe files to cunningly wrought (in their minds) emails enticing the gullible to hit a web site that will infest them through the browser. These are the emails that border filters try to keep out, and it is a fundamentally harder problem than .exe files were.
The big commercial vendors get the success rate they do for email cleaning in part because they deploy large networks of sensors all across the internet. Each device or software-install a customer turns on can potentially be a sensor. The sensors report back to the mother database, and proprietary and patented methods are used to distill out anti-spam recipes/definitions/modules for publishing to subscribed devices and software. There is nothing saying that an open-source product can't do this, but the mother-database is a big cost that someone has to pay for and is a very key part of this spam fighting strategy. Bayesian filtering only goes so far.
And yet, people expect email to just be clean. Especially at work. That is a heavy expectation to meet.
Friday, January 11, 2008
Disk-space over time
I've mentioned before that I do SNMP-based queries against NetWare and drop the resulting disk-usage data into a database. The current incarnation of this database went in August of 2004, so I have just over 4 years of data in it now. You can see some real trends in how we manage data in the charts.
To show you what I'm talking about, I'm going to post a chart based on the student-home-directory data. We have three home-directory volumes for students, which run between 7000-8000 home directories on them. We load-balance by number of directories rather than least-size. The chart:
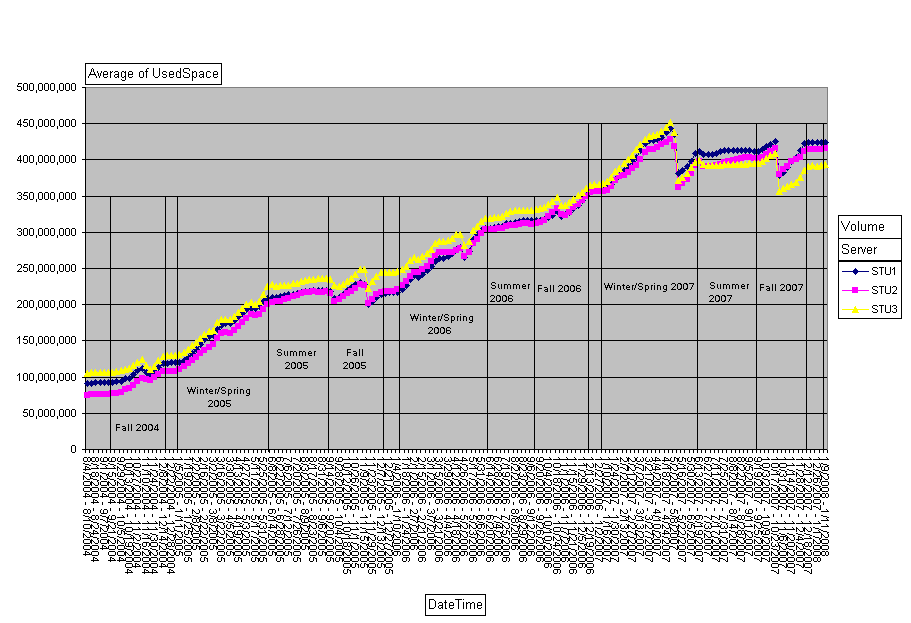
As you can see, I've marked up our quarters. Winter/Spring is one segment on this chart since Spring Break is hard to isolate on these scales. We JUST started Winter 2008, so the last dot on the chart is data from this week. If you squint in (or zoom in like I can) you can see that last dot is elevated from the dot before it, reflecting this week's classes.
There are several sudden jumps on the chart. Fall 2005. Spring 2005. Spring 2007 was a big one. Fall 2007 just as large. These reflect student delete processes. Once a student hasn't been registered for classes for a specified period of time (I don't know what it is off hand, but I think 2 terms) their account goes on the 'ineligible' list and gets purged. We do the purge once a quarter except for Summer. The Fall purge is generally the biggest in terms of numbers, but not always. Sometimes the number of students purged is so small it doesn't show on this chart.
We do get some growth over the summer, which is to be expected. The only time when classes are not in session is generally from the last half of August to the first half of September. Our printing volumes are also w-a-y down during that time.
Because the Winter purge is so tiny, Winter quarter tends to see the biggest net-gain in used disk-space. Fall quarter's net-gain sometimes comes out a wash due to the size of that purge. Yet if you look at the slopes of the lines for Fall, correcting for the purge of course, you see it matches Winter/Spring.
Somewhere in here, and I can't remember where, we increased the default student directory-quota from 200MB to 500MB. We've found Directory Quotas to be a much better method of managing student directory sizes than User Quotas. If I remember my architectures right, directory quotas are only possible because of how NSS is designed.
If you take a look at the "Last Modified Times" chart in the Volume Inventory for one of the student home-directory volumes you get another interesting picture:
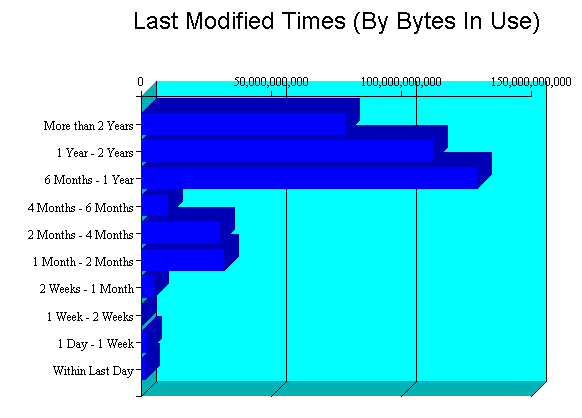
We have a big whack of data aged 12 months or newer. That said, we have non-trivial amounts of data aged 12 months or older. This represents where we'd get big savings when we move to OES2 and can use Dynamic Storage Technology (formerly known as 'shadowvolumes'). Because these are students and students only stick around for so long, we don't have a lot of stuff in the "older than 2 years" column that is very present on the Faculty/Staff volumes.
Being the 'slow, cheap,' storage device is a role well suited to the MSA1500 that has been plaguing me. If for some reason we fail to scare up funding to replace our EVA3000 with another EVA less filled-to-capacity, this could buy a couple of years of life on the EVA3000. Unfortunately, we can't go to OES2 until Novell ships an edirectory enabled AFP server for Linux, currently scheduled for late 2008 at the earliest.
Anyway, here is some insight into some of our storage challenges! Hope it has been interesting.
To show you what I'm talking about, I'm going to post a chart based on the student-home-directory data. We have three home-directory volumes for students, which run between 7000-8000 home directories on them. We load-balance by number of directories rather than least-size. The chart:
As you can see, I've marked up our quarters. Winter/Spring is one segment on this chart since Spring Break is hard to isolate on these scales. We JUST started Winter 2008, so the last dot on the chart is data from this week. If you squint in (or zoom in like I can) you can see that last dot is elevated from the dot before it, reflecting this week's classes.
There are several sudden jumps on the chart. Fall 2005. Spring 2005. Spring 2007 was a big one. Fall 2007 just as large. These reflect student delete processes. Once a student hasn't been registered for classes for a specified period of time (I don't know what it is off hand, but I think 2 terms) their account goes on the 'ineligible' list and gets purged. We do the purge once a quarter except for Summer. The Fall purge is generally the biggest in terms of numbers, but not always. Sometimes the number of students purged is so small it doesn't show on this chart.
We do get some growth over the summer, which is to be expected. The only time when classes are not in session is generally from the last half of August to the first half of September. Our printing volumes are also w-a-y down during that time.
Because the Winter purge is so tiny, Winter quarter tends to see the biggest net-gain in used disk-space. Fall quarter's net-gain sometimes comes out a wash due to the size of that purge. Yet if you look at the slopes of the lines for Fall, correcting for the purge of course, you see it matches Winter/Spring.
Somewhere in here, and I can't remember where, we increased the default student directory-quota from 200MB to 500MB. We've found Directory Quotas to be a much better method of managing student directory sizes than User Quotas. If I remember my architectures right, directory quotas are only possible because of how NSS is designed.
If you take a look at the "Last Modified Times" chart in the Volume Inventory for one of the student home-directory volumes you get another interesting picture:
We have a big whack of data aged 12 months or newer. That said, we have non-trivial amounts of data aged 12 months or older. This represents where we'd get big savings when we move to OES2 and can use Dynamic Storage Technology (formerly known as 'shadowvolumes'). Because these are students and students only stick around for so long, we don't have a lot of stuff in the "older than 2 years" column that is very present on the Faculty/Staff volumes.
Being the 'slow, cheap,' storage device is a role well suited to the MSA1500 that has been plaguing me. If for some reason we fail to scare up funding to replace our EVA3000 with another EVA less filled-to-capacity, this could buy a couple of years of life on the EVA3000. Unfortunately, we can't go to OES2 until Novell ships an edirectory enabled AFP server for Linux, currently scheduled for late 2008 at the earliest.
Anyway, here is some insight into some of our storage challenges! Hope it has been interesting.
Friday, December 29, 2006
Year in review: web-stats
So I won't have Saturday and Sunday in these stats. Big deal, don't care much. But heck, these are fun!
At a guess, I'd say that students are using the Student MyWeb service more as a link-space than as a web-page host. Since that space is linked in with their home-directory quota, and also isn't bandwidth limited, it provides a much better experience than things like photobucket. Since items like avatars are files that get hit a LOT, icon-hosting is something of a bugabo and having your own host for that is handy.
One 125K JPG file is the number one hit file on the Student MyWeb for fall quarter, and is also the #4 file in terms of bytes transferred. This file is a Friendster background. Clearly, this person has a lot of traffic to their friendster site. Of the top 10 files-by-hit, 7 are clearly icons, avatars, or other 'personalization' images. On the flip side, all but one of the top 10 files-by-transfer are movies; this one lone (big) JPG file is the exception.
Looking at the Facstaff side, and 8 of the top 10 files-by-hit are components of web-pages hosted on myweb.facstaff.wwu.edu. One is the feed-file for this blog, and the other is an EXE file hosted by ATUS that seems to get a lot of off-campus requests. The files-by-byes are a bit different, in that four of the top 10 are EXE files from the same page. There is a PDF and three PPT files in the top 10 by byte, and only one movie.
Interesting stuff.
MyWeb serversClearly, the Student myweb gets a LOT more traffic. A lot more bigger traffic, as the hits ratio is 8:1 but the data transferred ratio is closer to 10:1. Now, lets look at some averages:
Total sessions 2006Total pageviews 2006
- Student: 436,048
- Facstaff: 11,640
Total hits 2006
- Student: 2,927,305
- Facstaff: 760,077
Total bytes transferred 2006
- Student: 8,178,044
- Facstaff: 1,282,892
- Student: 1.74 TB
- Facstaff: 116.37 GB
MyWeb serversTHAT'S a difference! The traffic generated by the FacStaff MyWeb looks to be a lot more browsing, where I'd guess a lot of the traffic coming out of the Student MyWeb is one-off stuff like user-avatars in web-forums, and media files. The average session length is night-and-day, though; average session length of 42 minutes? Clearly there is a lot more 'dwell' on instructor sites than on the student sites.
Average pageviews per sessionAverage hits per session
- Student: 6.71
- Facstaff: 65.30
Average bytes per session
- Student: 18.75
- Facstaff: 110.21
Average length of session (HH:MM:SS)
- Student: 4.18 MB
- Facstaff: 10.24 MB
- Student: 00:04:14
- Facstaff: 00:42:21
At a guess, I'd say that students are using the Student MyWeb service more as a link-space than as a web-page host. Since that space is linked in with their home-directory quota, and also isn't bandwidth limited, it provides a much better experience than things like photobucket. Since items like avatars are files that get hit a LOT, icon-hosting is something of a bugabo and having your own host for that is handy.
One 125K JPG file is the number one hit file on the Student MyWeb for fall quarter, and is also the #4 file in terms of bytes transferred. This file is a Friendster background. Clearly, this person has a lot of traffic to their friendster site. Of the top 10 files-by-hit, 7 are clearly icons, avatars, or other 'personalization' images. On the flip side, all but one of the top 10 files-by-transfer are movies; this one lone (big) JPG file is the exception.
Looking at the Facstaff side, and 8 of the top 10 files-by-hit are components of web-pages hosted on myweb.facstaff.wwu.edu. One is the feed-file for this blog, and the other is an EXE file hosted by ATUS that seems to get a lot of off-campus requests. The files-by-byes are a bit different, in that four of the top 10 are EXE files from the same page. There is a PDF and three PPT files in the top 10 by byte, and only one movie.
Interesting stuff.
Labels: stats
Friday, December 15, 2006
Yummy stats (fall quarter)
Today is the close of fall quarter, so I'm taking a look at Student MyWeb usage for the quarter. First, some quick hits:
- 235GB were transferred.
- 609,501 page views.
- Top file by hit: http://myweb.students.wwu.edu/~beattya/cs102/Warming_Up_for_the_Night_s_Howl__Gray_Wolf.jpg at around 89,000 hits.
- Top file by bytes: http://myweb.students.wwu.edu/~conroyg/telltale.mov at 12.71GB. This is specifically interesting, since it got there only over the past week. I should probably take a look at that and see if its something I have to officially notice.
- #1 browser used (by hit): IE, at 48%
- #1 browser used (by session): "Mozilla Compatible Agent" at 47%
- #1 platform (by hit): Windows, at 66% (of which WinXP is 94%). #2 is Macintosh, at 19%.
- 146GB were transferred
- 516,866 pageviews.
- Top file by hit: http://myweb.facstaff.wwu.edu/%7Ebowkerb/ATUS/Utilities/OfficeConverterPack.EXE
- Top file by bytes: http://myweb.facstaff.wwu.edu/%7Ebowkerb/ATUS/Utilities/OfficeConverterPack.EXE by a long shot. This represented 25% of traffic!
- #1 browser used (by hit): IE at 61.2%
- #1 browser used (by session): IE at 38.62%
- #1 platform (by hit): Windows, at 79% (of which WinXP is 91%). #2 is 'unknown' at 12%, and Macintosh comes in at 7%.
Labels: stats
Thursday, February 09, 2006
Tracking storage
My storage-tracker has a year and a half worth of data in it. Last night we processed the winter-quarter student deletes. It did drop the student data a bit, but not anywhere near the level that the Fall delete did.
Chart here
The Fall delete happened about 11/20/05, and you can see the big hunk of space liberated by that action. Another thing of note is that the slope of the 'wuf-students' line is steeper than the Wuf-FacStaff line, so student data is growing faster that non-student data. But, thanks to regular user purges, overall growth is closer to normal.
The big anomaly of this summer on the facstaff line is due to the migration of three Shared volumes to one monolithic Shared volume. We were running in parallel for a while. What I found interesting is that the line either side of the big bump seems to match up well with growth patterns.
The Exchange line is pretty short as well. We're a bunch of quota-scrooges around here when it comes to mail, so mail growth is kept in check far better than file-storage. The mid-december blip is due to a realign of Exchange drives that the monitor didn't catch in time. The reallign also got rid of an annoying data-artifact we had; about 20GB of space on one Exchange drive was flagged (in error) bad-cluster, and this reported as 'used data'.
![]()
