I had to do some maintenance on my script that gathers disk-space usage, so the stats database has been on my mind lately. It's been a while since I posted any graphs. This particular graph is a unified chart of the student home-directory volumes over time. I merged the NetWare and Windows volumes into a single space-used chart.
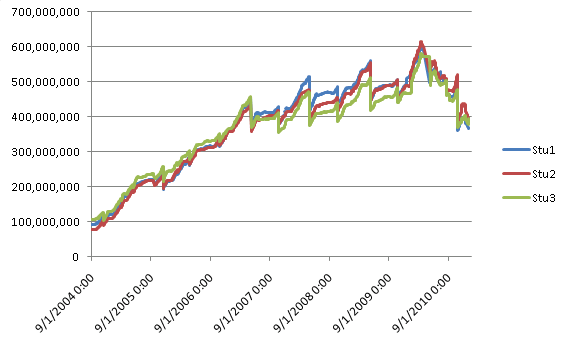
This is a very noisy chart.The discontinuities are mostly student-account-purge events that happen once a quarter, but the fall purge is by far the largest.
Note the downward tail at the end! The same chart for staff is a pretty smooth line straight up at a pretty steady slope. This? Clearly usage-habits are changing. I don't know if this is reflected by habitual USB-drive use or if they're using the cloud in some way to store their files, but clearly student-driven storage demand (at least for home-directories) is falling.
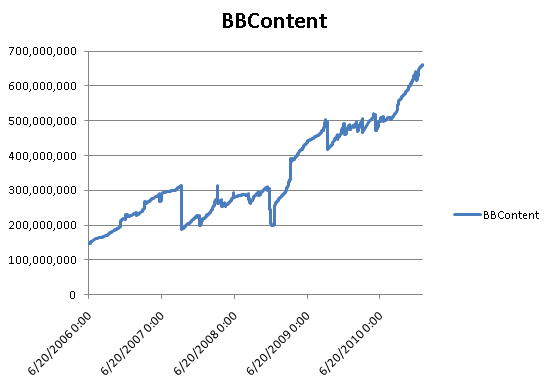
One area where it is clearly increasing is the Blackboard Content volume.
Note the downward tail at the end! The same chart for staff is a pretty smooth line straight up at a pretty steady slope. This? Clearly usage-habits are changing. I don't know if this is reflected by habitual USB-drive use or if they're using the cloud in some way to store their files, but clearly student-driven storage demand (at least for home-directories) is falling.
One area where it is clearly increasing is the Blackboard Content volume.
This data is noisy in that we purge old courses, but we've also changed how many quarters of courses we keep in the system. Looking at this growth chart, it's pretty clear to me that the downtick in student home-directory and class-volume consumption is made up for in increased Blackboard usage. Each quarter more and more professors sign on, other professors increase their usage, and the average size of the files being passed into the system increases.