I've mentioned before that I do SNMP-based queries against NetWare and drop the resulting disk-usage data into a database. The current incarnation of this database went in August of 2004, so I have just over 4 years of data in it now. You can see some real trends in how we manage data in the charts.
To show you what I'm talking about, I'm going to post a chart based on the student-home-directory data. We have three home-directory volumes for students, which run between 7000-8000 home directories on them. We load-balance by number of directories rather than least-size. The chart:
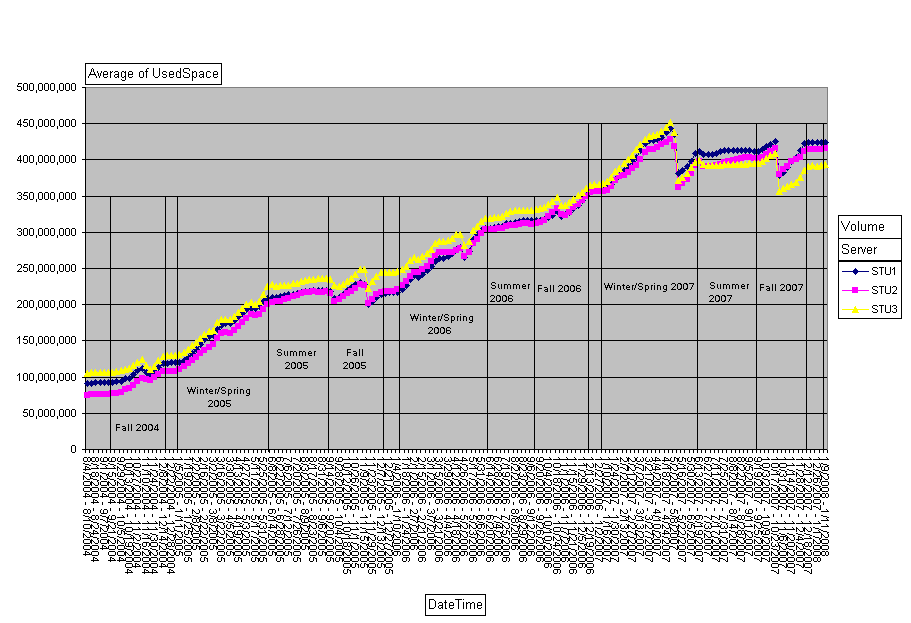
As you can see, I've marked up our quarters. Winter/Spring is one segment on this chart since Spring Break is hard to isolate on these scales. We JUST started Winter 2008, so the last dot on the chart is data from this week. If you squint in (or zoom in like I can) you can see that last dot is elevated from the dot before it, reflecting this week's classes.
There are several sudden jumps on the chart. Fall 2005. Spring 2005. Spring 2007 was a big one. Fall 2007 just as large. These reflect student delete processes. Once a student hasn't been registered for classes for a specified period of time (I don't know what it is off hand, but I think 2 terms) their account goes on the 'ineligible' list and gets purged. We do the purge once a quarter except for Summer. The Fall purge is generally the biggest in terms of numbers, but not always. Sometimes the number of students purged is so small it doesn't show on this chart.
We do get some growth over the summer, which is to be expected. The only time when classes are not in session is generally from the last half of August to the first half of September. Our printing volumes are also w-a-y down during that time.
Because the Winter purge is so tiny, Winter quarter tends to see the biggest net-gain in used disk-space. Fall quarter's net-gain sometimes comes out a wash due to the size of that purge. Yet if you look at the slopes of the lines for Fall, correcting for the purge of course, you see it matches Winter/Spring.
Somewhere in here, and I can't remember where, we increased the default student directory-quota from 200MB to 500MB. We've found Directory Quotas to be a much better method of managing student directory sizes than User Quotas. If I remember my architectures right, directory quotas are only possible because of how NSS is designed.
If you take a look at the "Last Modified Times" chart in the Volume Inventory for one of the student home-directory volumes you get another interesting picture:
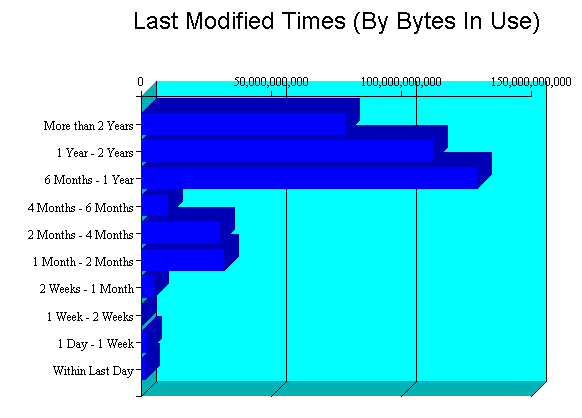
We have a big whack of data aged 12 months or newer. That said, we have non-trivial amounts of data aged 12 months or older. This represents where we'd get big savings when we move to OES2 and can use Dynamic Storage Technology (formerly known as 'shadowvolumes'). Because these are students and students only stick around for so long, we don't have a lot of stuff in the "older than 2 years" column that is very present on the Faculty/Staff volumes.
Being the 'slow, cheap,' storage device is a role well suited to the MSA1500 that has been plaguing me. If for some reason we fail to scare up funding to replace our EVA3000 with another EVA less filled-to-capacity, this could buy a couple of years of life on the EVA3000. Unfortunately, we can't go to OES2 until Novell ships an edirectory enabled AFP server for Linux, currently scheduled for late 2008 at the earliest.
Anyway, here is some insight into some of our storage challenges! Hope it has been interesting.
To show you what I'm talking about, I'm going to post a chart based on the student-home-directory data. We have three home-directory volumes for students, which run between 7000-8000 home directories on them. We load-balance by number of directories rather than least-size. The chart:
As you can see, I've marked up our quarters. Winter/Spring is one segment on this chart since Spring Break is hard to isolate on these scales. We JUST started Winter 2008, so the last dot on the chart is data from this week. If you squint in (or zoom in like I can) you can see that last dot is elevated from the dot before it, reflecting this week's classes.
There are several sudden jumps on the chart. Fall 2005. Spring 2005. Spring 2007 was a big one. Fall 2007 just as large. These reflect student delete processes. Once a student hasn't been registered for classes for a specified period of time (I don't know what it is off hand, but I think 2 terms) their account goes on the 'ineligible' list and gets purged. We do the purge once a quarter except for Summer. The Fall purge is generally the biggest in terms of numbers, but not always. Sometimes the number of students purged is so small it doesn't show on this chart.
We do get some growth over the summer, which is to be expected. The only time when classes are not in session is generally from the last half of August to the first half of September. Our printing volumes are also w-a-y down during that time.
Because the Winter purge is so tiny, Winter quarter tends to see the biggest net-gain in used disk-space. Fall quarter's net-gain sometimes comes out a wash due to the size of that purge. Yet if you look at the slopes of the lines for Fall, correcting for the purge of course, you see it matches Winter/Spring.
Somewhere in here, and I can't remember where, we increased the default student directory-quota from 200MB to 500MB. We've found Directory Quotas to be a much better method of managing student directory sizes than User Quotas. If I remember my architectures right, directory quotas are only possible because of how NSS is designed.
If you take a look at the "Last Modified Times" chart in the Volume Inventory for one of the student home-directory volumes you get another interesting picture:
We have a big whack of data aged 12 months or newer. That said, we have non-trivial amounts of data aged 12 months or older. This represents where we'd get big savings when we move to OES2 and can use Dynamic Storage Technology (formerly known as 'shadowvolumes'). Because these are students and students only stick around for so long, we don't have a lot of stuff in the "older than 2 years" column that is very present on the Faculty/Staff volumes.
Being the 'slow, cheap,' storage device is a role well suited to the MSA1500 that has been plaguing me. If for some reason we fail to scare up funding to replace our EVA3000 with another EVA less filled-to-capacity, this could buy a couple of years of life on the EVA3000. Unfortunately, we can't go to OES2 until Novell ships an edirectory enabled AFP server for Linux, currently scheduled for late 2008 at the earliest.
Anyway, here is some insight into some of our storage challenges! Hope it has been interesting.